+ - 0:00:00
Notes for current slide
Notes for next slide

Jittering and routing options for converting origin-destination data into route networks

Towards accurate estimates of movement at the street level

Robin Lovelace, University of Leeds
+Rosa Félix, Dustin Carlino

1 / 25
2 / 25

Background

  • We need to build dense walking/cycling/wheeling networks
  • But where?

Source: Cycle Routing Uptake and Scenario Estimation (CRUSE) tool

3 / 25

Tools of the trade

4 / 25

Tools of the trade

4 / 25
  • Need for more sustainable transport systems
  • Local authorities need data
  • We've developed a number of tools that provide this data

Modelling framework and long-standing limitations

Modular

Future proof

Scalable

Vector/

Raster/

Source: Morgan and Lovelace (2020) Implementation: stplanr

5 / 25

Modelling framework and long-standing limitations

Modular

Future proof

Scalable

Vector/

Raster/

Source: Morgan and Lovelace (2020) Implementation: stplanr

Approach: OD -> Desire Line -> Route -> Route Networks

5 / 25

What is Jittering?

Source: Lovelace, R., Félix, R., & Carlino, D. (2022, January 13). Jittering: A computationally efficient method for generating realistic route networks from origin-destination data. Transport Findings, in Press https://doi.org/10.31219/osf.io/qux6g

6 / 25

Current default: centroid-based desire lines (+routes+rnets)

7 / 25

Jittering in action: minimal reproducible example

8 / 25

Jittering a larger dataset

Adding value and detail to existing OD data. Source: Lovelace, Félix and Carlino (2022)

9 / 25

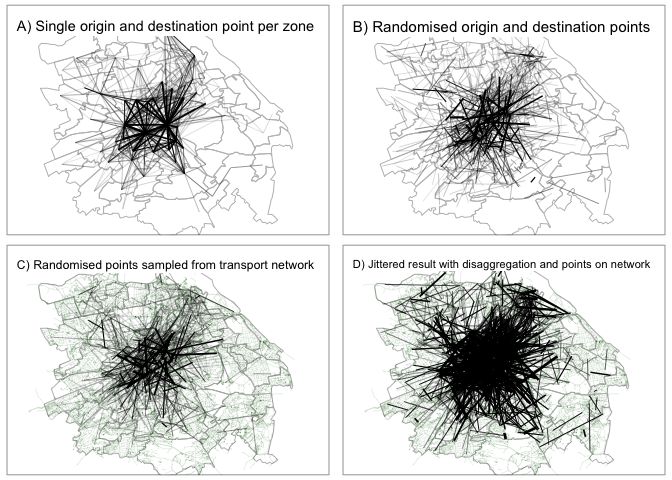
Resulting route network

10 / 25

Validating the approach: MKI

Data from Edinburgh. Source: GISRUK 2022 conference paper.

11 / 25

Validating the approach: MKI

Data from Edinburgh. Source: GISRUK 2022 conference paper.

See slides here

11 / 25

Model experiments: jittering parameters

12 / 25

Results From Edinburgh

13 / 25

Changing jittering and routing params

The 'jittering only' approach is assumes perfect routing, not true

Model/data discrepancies may be more due to routing than jittering/OD parameters

Enter Lisbon!

14 / 25

Network level results

15 / 25

Summary of results

16 / 25

Next steps

Exploring the parameter space: different origin and destination points + weights, routing 'engines', disaggregation.

Selection of input data: open options

  • Traffic count data
  • Urban Observatory type data (Newcastle, Birmingham, Manchester)
  • Faceboook and Google open mobility data
  • 'OSM2od' - spatial interaction model
  • Modelled data
    • jittering: spatial disaggregation
    • temporal disaggregation

Non-open data data

  • National Travel Survey
  • Mobile Telephone Data
  • Large GPS type data (biobank, Google timeline, Straval)
17 / 25

Appendix: Reproducible code I: Rust implementation

See reproducible repo + manuscript here: https://github.com/Robinlovelace/odnet

System command line implementation (compile Rust code):

cargo install --git https://github.com/dabreegster/odjitter
odjitter jitter --od-csv-path od_iz_ed.csv \
--zones-path iz_zones11_ed.geojson \
--subpoints-path road_network_ed.geojson \
--max-per-od 10 --output-path output_max50.geojson
18 / 25

Reproducible code II: R implementation

(See code in slides.Rmd in robinlovelace/foss4g22 for code to get data)

remotes::install_github("dabreegster/odjitter", subdir = "r")
od = read_csv("od_iz_ed.csv")
zones = sf::read_sf("iz_zones11_ed.geojson")
od_jittered = odjitter::jitter(
od = od,
zones = zones,
subpoints = sf::read_sf("road_network_ed.geojson")
)
od_jittered2 = odjitter::jitter(
od = od,
zones = zones,
subpoints = sf::read_sf("road_network_ed.geojson"),
disaggregation_key = "all",
disaggregation_threshold = 10
)
19 / 25

Results of reprex 1

od_sf = od::od_to_sf(
od,
zones
)
nrow(od_sf)
## [1] 10394
nrow(od_jittered)
## [1] 10394
nrow(od_jittered2)
## [1] 22432
20 / 25

Plot of unjittered data

library(dplyr)
plot(od_sf$geometry,
lwd = od_sf$all / 500)
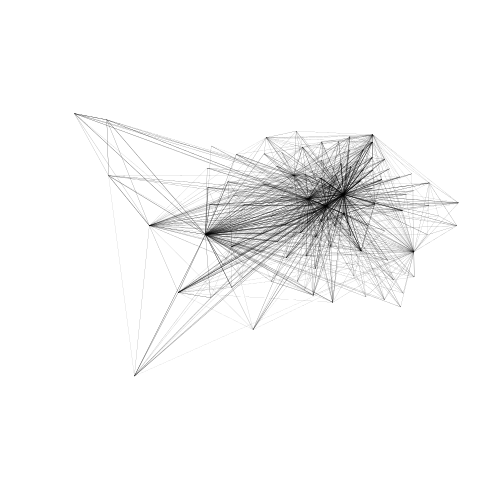
21 / 25

Results of reprex 2

plot(od_jittered$geometry,
lwd = od_jittered$all / 500)
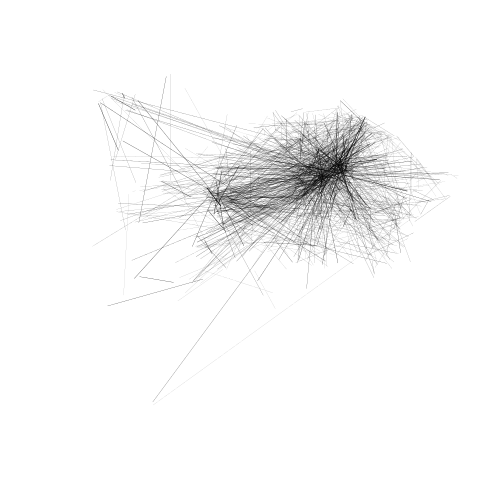
22 / 25

Results of reprex 3

plot(od_jittered2$geometry,
lwd = od_jittered2$all / 50)

23 / 25

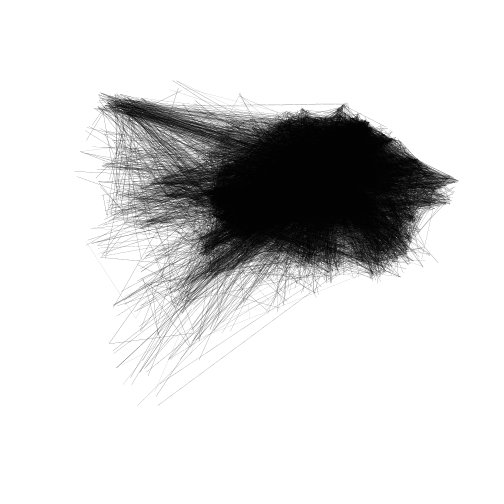
Alternative validation datasets: OA-WPZ data

There are 17,848,366 OA to WPZ records, 170k OAs, 54k WPZ

For 5km buffer around London, 1.5 million OD pairs with destinations

24 / 25

Reproducible example

u = "https://github.com/ITSLeeds/od/releases/download/v0.3.1/od_intra_top_sf.geojson"
desire_lines_oa_wpz_1k = sf::read_sf(u)
oas_in_buffer = sf::read_sf("https://github.com/ITSLeeds/od/releases/download/v0.3.1/oas_in_buffer.geojson")
wpz_in_buffer = sf::read_sf("https://github.com/ITSLeeds/od/releases/download/v0.3.1/wpz_in_buffer.geojson")
library(tmap)
tmap_mode("view")
## tmap mode set to interactive viewing
m = tm_shape(desire_lines_oa_wpz_1k) +
tm_lines() +
tm_shape(oas_in_buffer) + tm_dots(col = "darkgreen") +
tm_shape(wpz_in_buffer) + tm_dots(col = "darkred")

See here for map

25 / 25
2 / 25
Paused

Help

Keyboard shortcuts

, , Pg Up, k Go to previous slide
, , Pg Dn, Space, j Go to next slide
Home Go to first slide
End Go to last slide
Number + Return Go to specific slide
b / m / f Toggle blackout / mirrored / fullscreen mode
c Clone slideshow
p Toggle presenter mode
t Restart the presentation timer
?, h Toggle this help
Esc Back to slideshow