Background

Tools of the trade
![]()

Tools of the trade
![]()
Evidence-based policies in government: Data Science Fellowship at N. 10
Future areas of development: Reproducible Bayesian modelling of proportions (Dirichlet regression), Machine Learning, Decarbonisation Agenda

 Source: Morgan and Lovelace (
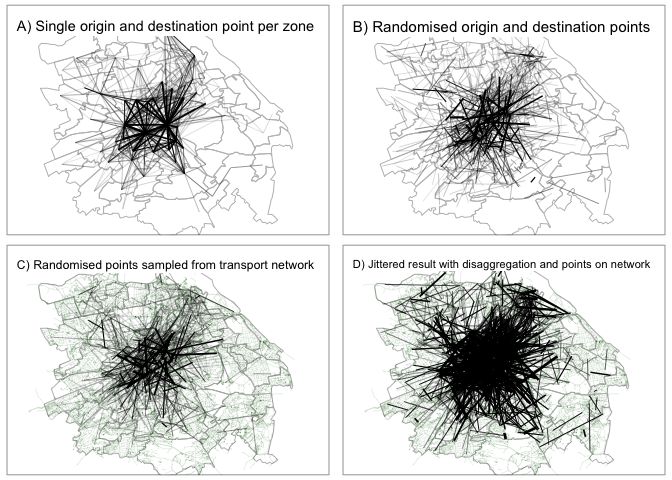
What is Jittering?

Source: Lovelace, R., Félix, R., & Carlino, D. (2022, January 13). Jittering: A computationally efficient method for generating realistic route networks from origin-destination data. Transport Findings, in Press https://doi.org/10.31219/osf.io/qux6g
Current default: centroid-based desire lines (+routes+rnets)

Jittering in action: minimal reproducible example

Jittering a larger dataset
Adding value and detail to existing OD data. Source: Lovelace, Félix and Carlino (2022 preprint)
Resulting route network

Validating the approach: this paper!
Problem: we need a validation dataset

Model experiments: jittering parameters

Results!


Alternative validation datasets: OA-WPZ data
There are 17,848,366 OA to WPZ records, 170k OAs, 54k WPZ
For 5km buffer around London, 1.5 million OD pairs with destinations

Reproducible example
u = "https://github.com/ITSLeeds/od/releases/download/v0.3.1/od_intra_top_sf.geojson"desire_lines_oa_wpz_1k = sf::read_sf(u)oas_in_buffer = sf::read_sf("https://github.com/ITSLeeds/od/releases/download/v0.3.1/oas_in_buffer.geojson")wpz_in_buffer = sf::read_sf("https://github.com/ITSLeeds/od/releases/download/v0.3.1/wpz_in_buffer.geojson")library(tmap)tmap_mode("view")## tmap mode set to interactive viewingm = tm_shape(desire_lines_oa_wpz_1k) + tm_lines() + tm_shape(oas_in_buffer) + tm_dots(col = "darkgreen") + tm_shape(wpz_in_buffer) + tm_dots(col = "darkred")See here for map

Open source software, community building
- New high performance libraries

 Source: Lovelace, Tennekes, Carlino (