class: center, middle, inverse, title-slide .title[ # Open source and participatory transportation planning ] .subtitle[ ## DERI Seminar, London, Zoom ] .author[ ### Robin Lovelace, University of Leeds
Dustin Carlino, Alan Turing Institute
Companion slides:
Google Slides
] .date[ ### 2023-01-26 ] --- ## Outline plan #### 1 Introduction to open tools for transport planning - https://www.pct.bike/ - https://www.cyipt.bike/rapid/ - https://github.com/ITSLeeds/ -- #### 2 Case study: A/B Street (Dustin) -- --- ## 1 Introduction to me and my research  Further info: https://www.robinlovelace.net/ ??? We have 5 research groups Working with TASM Links with WYCA Academic input Sarah Sharples --- # Data can make a difference  ??? Where I am now: PCT used by many in government --- .left-column[ ### Too much data? A nice problem to have? Data historically a limiting factor 
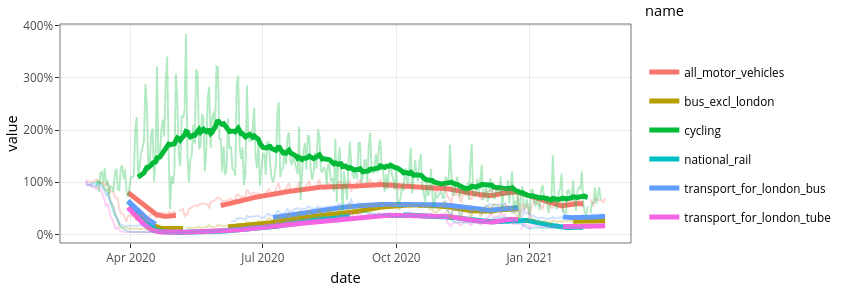
New approaches needed to tackle 'big noise' Boyce, D.E., Williams, H.C.W.L., 2015. Forecasting Urban Travel: Past, Present and Future. ] -- .right-column[ <!--  -->  Lovelace, Robin, Mark Birkin, Philip Cross, and Martin Clarke. 2016. ‘From Big Noise to Big Data' https://doi.org/10.1111/gean.12081. ] ??? - For most of the history of transport planning data scarcity has been a major concern - Now we have an abundance of datasets, many of them incompatible - Concrete example: OD to WPZ data in central London (could ask if anyone knows, it's a mess hehe) --- #### Problems worthy of your time -- .left-column[ # Ideas Hackathons Active travel Road safety policy Post COVID recovery Levelling up metrics Nature recovery networks Citizen science and data literacy ] .right-column[   ] --- # 
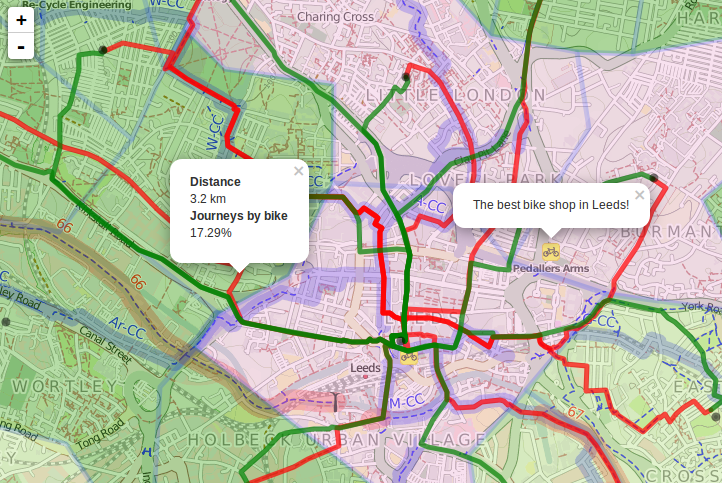
Existing tools: The Propensity to Cycle Tool - Early prototype of the tool developed at Open Data Institute Leeds hackathon, 2015 - National deployment of the Propensity to Cycle Tool 2 years later ([PCT.bike](http://www.pct.bike/)) (Lovelace et al. 2017) <!-- --> --- ## Key aspects of the PCT - Based on open source code - Based on open data - Results published as open data - Publicly available web application encourages participation and evidence-based debate Open data and accessible results lead to participation. See https://twitter.com/search?q=cyipt.bike%2Frapid  --- ## How it works  --- ## Making evidence meaningful and actionable Source: https://www.pct.bike/  --- .left-column[ ### The future of transport tools Modular Future proof Scalable Vector/  Raster/  Source: Morgan and Lovelace ([2020](https://doi.org/10.1177/2399808320942779 )) Implementation: [stplanr](https://docs.ropensci.org/stplanr/index.html) ] -- .right-column[ <!-- --> Approach: OD -> Desire Line -> Route -> Route Networks ] ??? So what's the overall approach here? --- class: center, middle # Thanks! -- ## References -- Lovelace, R., Goodman, A., Aldred, R., Berkoff, N., Abbas, A., Woodcock, J., 2017. The Propensity to Cycle Tool: An open source online system for sustainable transport planning. Journal of Transport and Land Use 10. https://doi.org/10.5198/jtlu.2016.862 -- Morgan, M., Lovelace, R., 2020. Travel flow aggregation: nationally scalable methods for interactive and online visualisation of transport behaviour at the road network level. Environment & Planning B: Planning & Design. https://doi.org/10.1177/2399808320942779 -- Lovelace, R., Tennekes, M., Carlino, D., 2021. ClockBoard: a zoning system for urban analysis. https://doi.org/10.31219/osf.io/vncgw -- Lovelace, Robin, Rosa Félix, and Dustin Carlino. “Jittering: A Computationally Efficient Method for Generating Realistic Route Networks from Origin-Destination Data.” OSF Preprints, January 13, 2022. https://doi.org/10.31219/osf.io/qux6g.