
Data can make a difference

Too much data?
A nice problem to have?
Data historically a limiting factor
New approaches needed to tackle 'big noise'
Boyce, D.E., Williams, H.C.W.L., 2015. Forecasting Urban Travel: Past, Present and Future.

Lovelace, Robin, Mark Birkin, Philip Cross, and Martin Clarke. 2016. ‘From Big Noise to Big Data' https://doi.org/10.1111/gean.12081.
Problems worthy of your time
Ideas
Hackathons
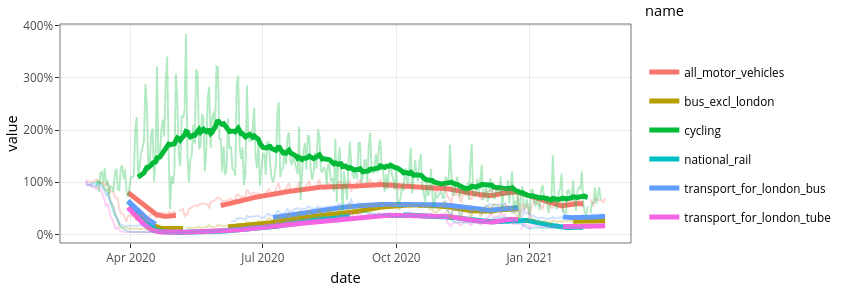
Active travel
Road safety policy
Post COVID recovery
Levelling up metrics
Nature recovery networks
Citizen science and data literacy
Existing tools: The Propensity to Cycle Tool
- Early prototype of the tool developed at Open Data Institute Leeds hackathon, 2015
- National deployment of the Propensity to Cycle Tool 2 years later (PCT.bike) (Lovelace et al. 2017)
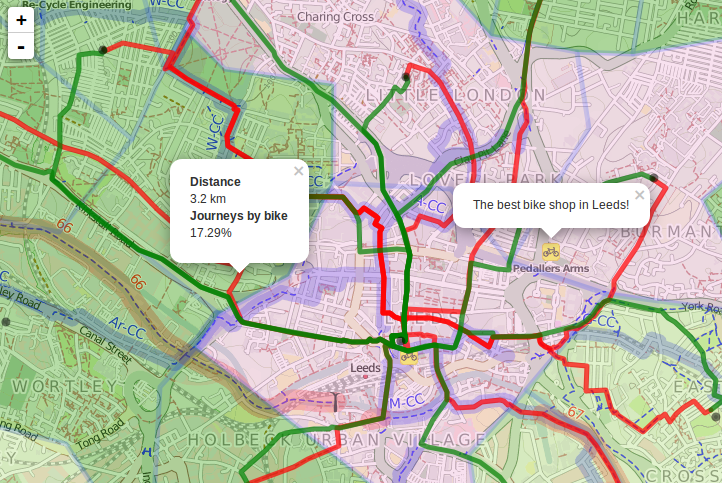
Key aspects of the PCT
- Based on open source code
- Based on open data
- Results published as open data
- Publicly available web application encourages participation and evidence-based debate
Open data and accessible results lead to participation. See https://twitter.com/search?q=cyipt.bike%2Frapid

Reproducibility and extending the tool
- Find commuting desire lines in West Yorkshire between 1 and 3 km long in which more people drive than cycle:
How it works


2 New and emerging tools
![]()

2 New and emerging tools
![]()
Evidence-based policies in government: Data Science Fellowship at N. 10
Future areas of development: Reproducible Bayesian modelling of proportions (Dirichlet regression), Machine Learning, Decarbonisation Agenda

 Source: Morgan and Lovelace (
The ActDev project: https://actdev.cyipt.bike/

- A/B Street - R integration, see https://github.com/a-b-street/abstr
- Give it a try!
- Find a new housing development that has good active travel provision and potential
- How could active travel provision be made better?
- Find a housing development that has poor active travel provision
- How could active travel provision be improved, based on the data?
- Should new houses be built in this location?
- Find a new housing development that has good active travel provision and potential

 Source: Lovelace, Tennekes, Carlino (