The role of data analysis is to make people change their mind, based on the data
R provides unparalleled support for reproducible research. Its command-line interface and scriptable nature is revolutionary for people who previously relied on explaining a long series of steps in a graphical user interface to enable others to reproduce their work. Furthermore, R has many tools to enable the efficient replication of results in everything ranging from minimal examples (e.g. via the function dput() and the package reprex) to large projects (e.g. via Makefiles and workflow management packages such as drake).
It has been well-known that reproducibility (and its corollary falsifiability) are cornerstones of science since the time of Karl Popper, but few have considered the implications for policy. This presentation will outline ways in which research design decisions can maximise the chances of informing evidence-based policies. This includes choice of software and the way in which code underlying research is written, maintained and disseminated. Case studies from my work on the Propensity to Cycle Tool (the results of which are freely available at www.pct.bike), which has informed government transport policies, and the package for accessing road traffic casualty data stats19 will illustrate these points. The talk will conclude with concrete steps that everyone can take to maximise the reproducibility of not only their code but also the key results of research to encourage scientific debate and evidence-based decisions.
system("whoami")
system("whoami")
devtools::install_github("r-rust/gifski")system("youtube-dl https://youtu.be/CzxeJlgePV4 -o v.mp4")system("ffmpeg -i v.mp4 -t 00:00:03 -c copy out.mp4")system("ffmpeg -i out.mp4 frame%04d.png ")f = list.files(pattern = "frame")gifski::gifski(f, gif_file = "g.gif", width = 200, height = 200)
Image credit: Jeroen Ooms + others
knitr::include_graphics("https://user-images.githubusercontent.com/1825120/39661313-534efd66-5047-11e8-8d99-a5597fe160ff.gif")
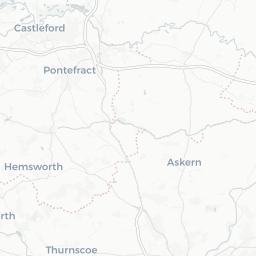
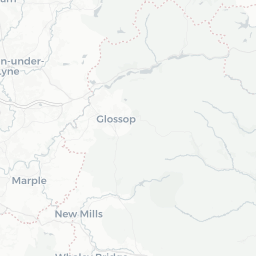
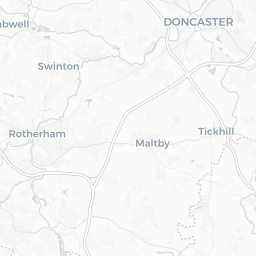
Source: the Propensity to Cycle Tool (PCT) project, demo at www.pct.bike
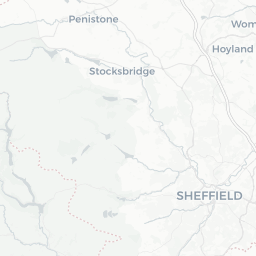
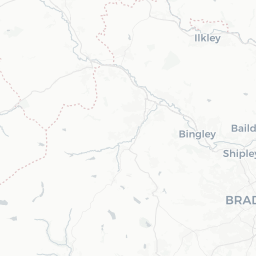
Source - https://github.com/npct which hosts national web tool PCT www.pct.bike
Used by the Parliamentary library to provide evidence for Members of Parliament (MPs): https://commonslibrary.parliament.uk/economy-business/transport/roads/constituency-data-traffic-accidents/
Reproducibility
Generalisability
Teamwork
Stability
Visualisation
Packaging
Promotion
Feedback
Adaptability
library(pct)rnet = get_pct_rnet("west-yorkshire")mapview::mapview(rnet[rnet$dutch_slc > 500, "dutch_slc"])
We welcomed sfnetworks v0.3.0 "Gievenbeck" (https://t.co/8g5uaxEqbo) with a webinar on Tidy Geospatial Networks in R today. Thank you panelist and participants!
— Lorena Abad (@loreabad6) June 16, 2020
If you missed it, slides are here: https://t.co/hiqbD9Jrik
See you this afternoon for the hackathon! pic.twitter.com/Rf8UhdtEW8
Sustainable transport advocates need your help!
Get started:
install.packages("sf")install.packages("stplanr")install.packages("osmdata")
Want more interventions like this in your city? The Rapid Cycleway Prioritisation Tool could help identify promising roads for investment in such road space reallocation schemes: https://t.co/ITIFGaD454 https://t.co/FrWaRZZWEs
— Robin Lovelace (@robinlovelace) June 16, 2020
Kruschke, J., 2010. Doing Bayesian Data Analysis: A Tutorial Introduction with R. Academic Press.
Lovelace, R., Nowosad, J., Muenchow, J., 2019. Geocomputation with R. CRC Press.
Lovelace, R., Morgan, M., Talbot, J., Lucas-Smith, M., 2020. Methods to prioritise pop-up active transport infrastructure (preprint). Open Science Framework. https://doi.org/10.31219/osf.io/7wjb6
Vicente-Saez, R., Martinez-Fuentes, C., 2018. Open Science now: A systematic literature review for an integrated definition. Journal of Business Research 88, 428–436. https://doi.org/10.1016/j.jbusres.2017.12.043
Even better than reading academic papers...
Contact local civil society / advocacy / campaigning groups offering your skills
Contact me at r. lovelace at leeds ac dot uk (email), @robinlovelace
Check-out links to my work at robinlovelace.net
Contact me at r. lovelace at leeds ac dot uk (email), @robinlovelace
Check-out links to my work at robinlovelace.net
Thanks to everyone for building a open and collaborative communities
Thanks to the University of Leeds and the Institute for Transport Studies
The role of data analysis is to make people change their mind, based on the data
Keyboard shortcuts
↑, ←, Pg Up, k | Go to previous slide |
↓, →, Pg Dn, Space, j | Go to next slide |
Home | Go to first slide |
End | Go to last slide |
Number + Return | Go to specific slide |
b / m / f | Toggle blackout / mirrored / fullscreen mode |
c | Clone slideshow |
p | Toggle presenter mode |
t | Restart the presentation timer |
?, h | Toggle this help |
Esc | Back to slideshow |