R for transport planning
Making it more data-driven, modular and open
Robin Lovelace, Institute for Transport Studies and Leeds Institute for Data Analytics, University of Leeds
2019-07-10, UseR 2019
Abstract
Since the first release of R on CRAN, in 1997, its use in many fields has grown rapidly. Lai et al. (2019), for example, suggest that more than 50% of research articles published in Ecology use R in some way.
Abstract
Since the first release of R on CRAN, in 1997, its use in many fields has grown rapidly. Lai et al. (2019), for example, suggest that more than 50% of research articles published in Ecology use R in some way.
Much like many ecological datasets, transport datasets tend to be large, diverse and have spatial and temporal attributes.
Unlike Ecology, Transport Planning has been a slow adopter of R, with a much lower percentage of papers using the language. This raises the question: why? After exploring this question, in relation to dominant transport planning software products, the talk will sketch of what an open source transport planning 'ecosystem' could look like. Based on my own experience, of developing the stplanr package and teaching practitioners, the talk will discuss the importance of building 'communities of practice, for transport planners making the switch to R. These observations relate to others promoting R in new environments, and link to the wider question of how to advocate for open source software in wider society.
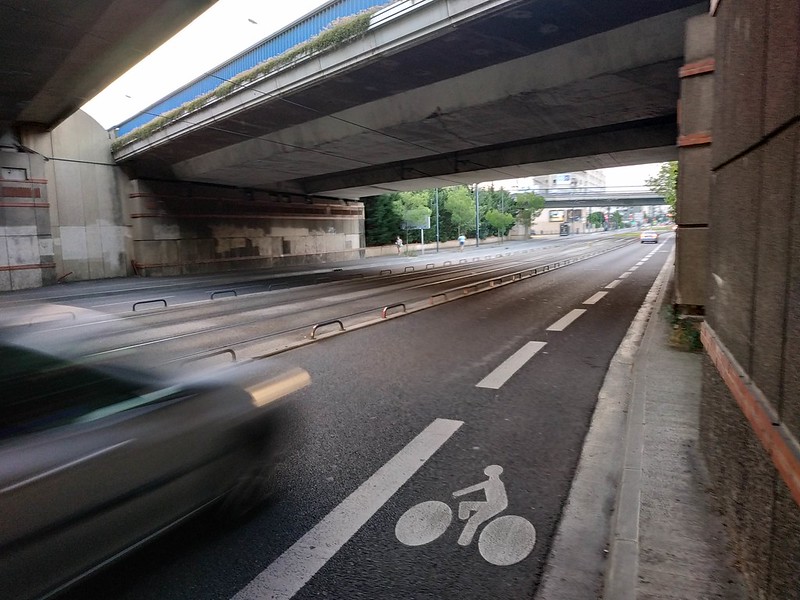
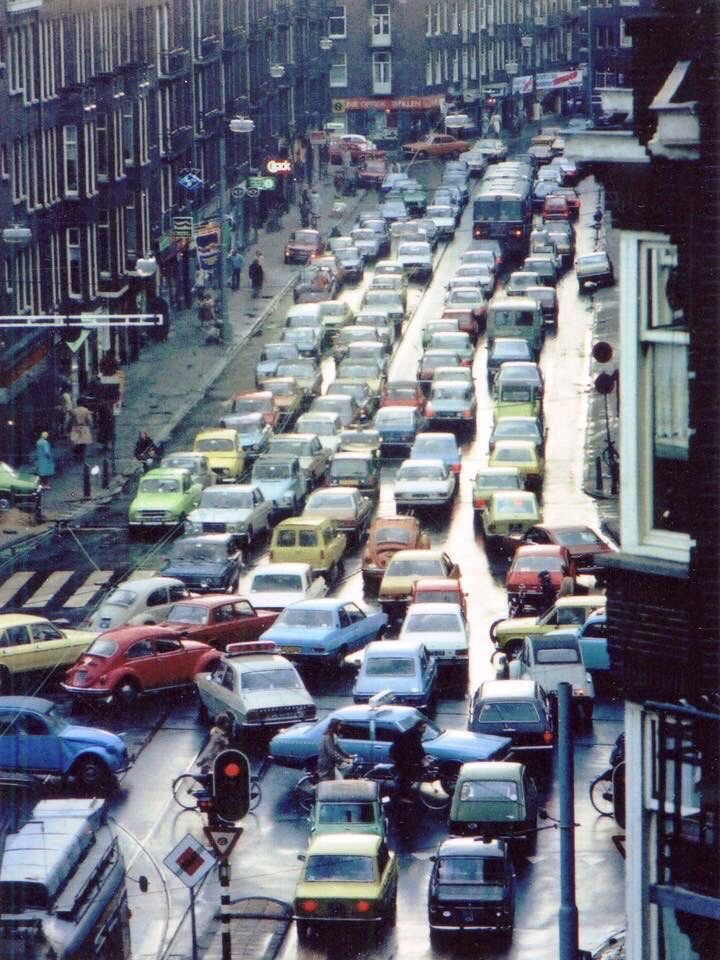

Amsterdam in the 2010s Brent Toderian
For more, see historical photos of Amsterdam, e.g. from fastcompany.com
Road casualty rates worldwide. Source: WHO. Code: Robinlovelace/useR2019
Transport is the number 1 cause of death among young people (WHO 2018)
- Fast growing source of energy use and pollution
- No 'upper limit' on use
- Inequalities
- Number 1 cause of death and injury among young people wide
Transport emissions
With-out aggressive and sustained mitigation policies being implemented, transport sector emissions could increase faster than in the other energy end-use sectors and could lead to more than a doubling of CO2 emissions by 2050. (IPCC, 2015)
Transport emissions
With-out aggressive and sustained mitigation policies being implemented, transport sector emissions could increase faster than in the other energy end-use sectors and could lead to more than a doubling of CO2 emissions by 2050. (IPCC, 2015)
Transport is hard to decarbonise (Creutzig et al. 2015)
Technological change is slow and uncertain. Demand reduction is required.
International Energy Agency's optimistic 'SDS' scenario:
Why transport planning with R?
- Integration of most transport planning tasks into a single workflow. For example, the Propensity to Cycle Tool (www.pct.bike) (Lovelace et al. 2017; Goodman et al. 2019)
Geographic data
- Strong geo community
Reproducibility
- Transport is inherently part of the democratic process
Good transport decision making requires public understanding. R is outstanding at visualisation.
+There is a growing R-transport community
R has a strong and cohesive spatial community
Transport is inherently part of the democratic desision-making process making transparency key. Reproducibility is a strength of R.
The R transport ecosystem by mode
Walking
Cycling
- cyclestreets
- bikedata
- cycleRtools (sport cycling)
Public transport
Multi-modal transport
The R transport ecosystem by mode
Walking
Cycling
- cyclestreets
- bikedata
- cycleRtools (sport cycling)
Public transport
Multi-modal transport
# To install these packages:install.packages( "walkscoreAPI", "walkalytics", "cyclestreets", "bikedata", "cycleRtools" "tidytransit" )remotes::install_github( "moveability/moveability", "itsleeds/opentripplanner", "GIScience/openrouteservice-r")Transport ecosystem by geographic level
Area based analysis
Origin destination data
Routes
- trajectories
- Routing services
Route networks
- SpatialLinesNetwork class
- sfnetworks - upcoming blog post: github.com/spnethack/spnethack
Transport ecosystem by geographic level
Area based analysis
Origin destination data
Routes
- trajectories
- Routing services
Route networks
- SpatialLinesNetwork class
- sfnetworks - upcoming blog post: github.com/spnethack/spnethack
# To install these packages:install.packages( "sf", "raster", "stplanr", "flows" )remotes::install_github( "luukvdmeer/sfnetworks")Useful guiding principle in Transport Planning (see transport chapter in Geocomputation with R)
- Note: there are many other packages for transport planning- not comprehensive lists
Current transport software
Credit: Crispin Cooper, author of C++ library sDNA
The four stage model
![]()
Still dominates transport planning models (Boyce and Williams 2015)
The four stage model
![]()
Still dominates transport planning models (Boyce and Williams 2015)
Software landscape
Dominated by a few proprietary products
Limited support community online
High degree of lock-in
Limited cross-department collaboration
Existing products
| Software | Company/Developer | Company HQ | Licence | Citations |
|---|---|---|---|---|
| Visum | PTV | Germany | Proprietary | 1810 |
| MATSim | TU Berlin | Germany | Open source (GPL) | 1470 |
| TransCAD | Caliper | USA | Proprietary | 1360 |
| SUMO | DLR | Germany | Open source (EPL) | 1310 |
| Emme | INRO | Canada | Proprietary | 780 |
| Cube | Citilabs | USA | Proprietary | 400 |
| sDNA | Cardiff University | UK | Proprietary | 170 |
User support
Getting help is vital for leaning/improving software
User support
Getting help is vital for leaning/improving software
![]()
Transport planning is PRICEY
"10-Hour Service Pack $2,000" (source: caliper.com/tcprice.htm)
![]()
Source: google.com/search?q=transcad+price
Where next for R-transport?
Questions and suggestions
Shift focus to communication of what's already possible
'Dev story' of existing products: A 'Better planning in less time' article, building on Lowndes et al. (2017)? E.g. for (PCT.bike)
For developers: invite others to contribute and open issues
For potential developers: consider contributing to existing projects before creating new ones
For everyone: cite code, communicate, collaborate
Questions
- Is there a need for a 'transportverse'?
- How can we best take this forward?
Credits, references and further links
Credits, references and further links
Boyce, D.E., Williams, H.C.W.L., 2015. Forecasting Urban Travel: Past, Present and Future. Edward Elgar Publishing.
Credits, references and further links
Boyce, D.E., Williams, H.C.W.L., 2015. Forecasting Urban Travel: Past, Present and Future. Edward Elgar Publishing.
The Propensity to Cycle Tool: http://www.pct.bike/ Lovelace, R., Goodman, A., Aldred, R., Berkoff, N., Abbas, A., Woodcock, J., 2017. The Propensity to Cycle Tool: An open source online system for sustainable transport planning. Journal of Transport and Land Use 10. https://doi.org/10.5198/jtlu.2016.862
Goodman, Anna, et al. "Scenarios of cycling to school in England, and associated health and carbon impacts: Application of the ‘Propensity to Cycle Tool’." Journal of Transport & Health 12 (2019): 263-278.
Open source 'geocompr' book: Lovelace, R., Nowosad, J., Meunchow, J., 2019. Geocomputation with R. CRC Press: https://geocompr.robinlovelace.net/
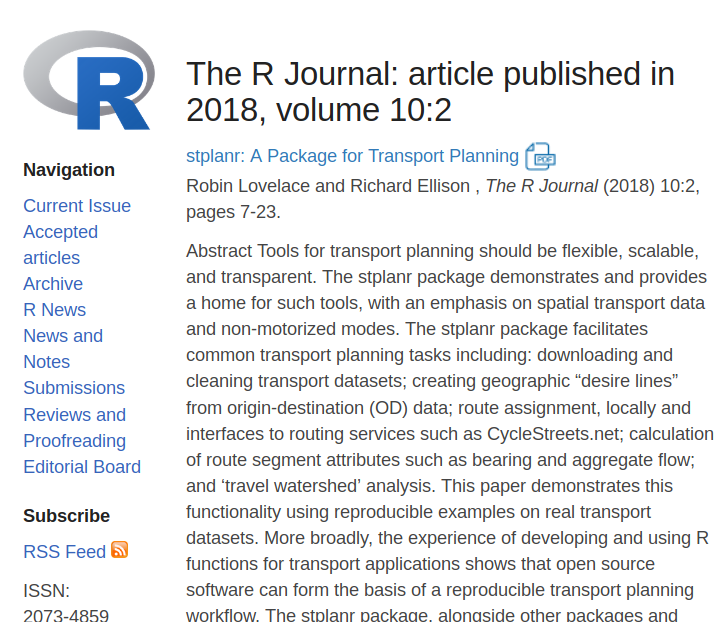
Lovelace, Robin, and Richard Ellison. "stplanr: A package for transport planning." The R Journal 10.2 (2018): 7-23.
Credits, references and further links
Boyce, D.E., Williams, H.C.W.L., 2015. Forecasting Urban Travel: Past, Present and Future. Edward Elgar Publishing.
The Propensity to Cycle Tool: http://www.pct.bike/ Lovelace, R., Goodman, A., Aldred, R., Berkoff, N., Abbas, A., Woodcock, J., 2017. The Propensity to Cycle Tool: An open source online system for sustainable transport planning. Journal of Transport and Land Use 10. https://doi.org/10.5198/jtlu.2016.862
Goodman, Anna, et al. "Scenarios of cycling to school in England, and associated health and carbon impacts: Application of the ‘Propensity to Cycle Tool’." Journal of Transport & Health 12 (2019): 263-278.
Open source 'geocompr' book: Lovelace, R., Nowosad, J., Meunchow, J., 2019. Geocomputation with R. CRC Press: https://geocompr.robinlovelace.net/
Lovelace, Robin, and Richard Ellison. "stplanr: A package for transport planning." The R Journal 10.2 (2018): 7-23.
To get in touch: GitHub, Twitter, or email at r. lovelace. at leeds dot ac. uk!
Safe travels!


Gamification
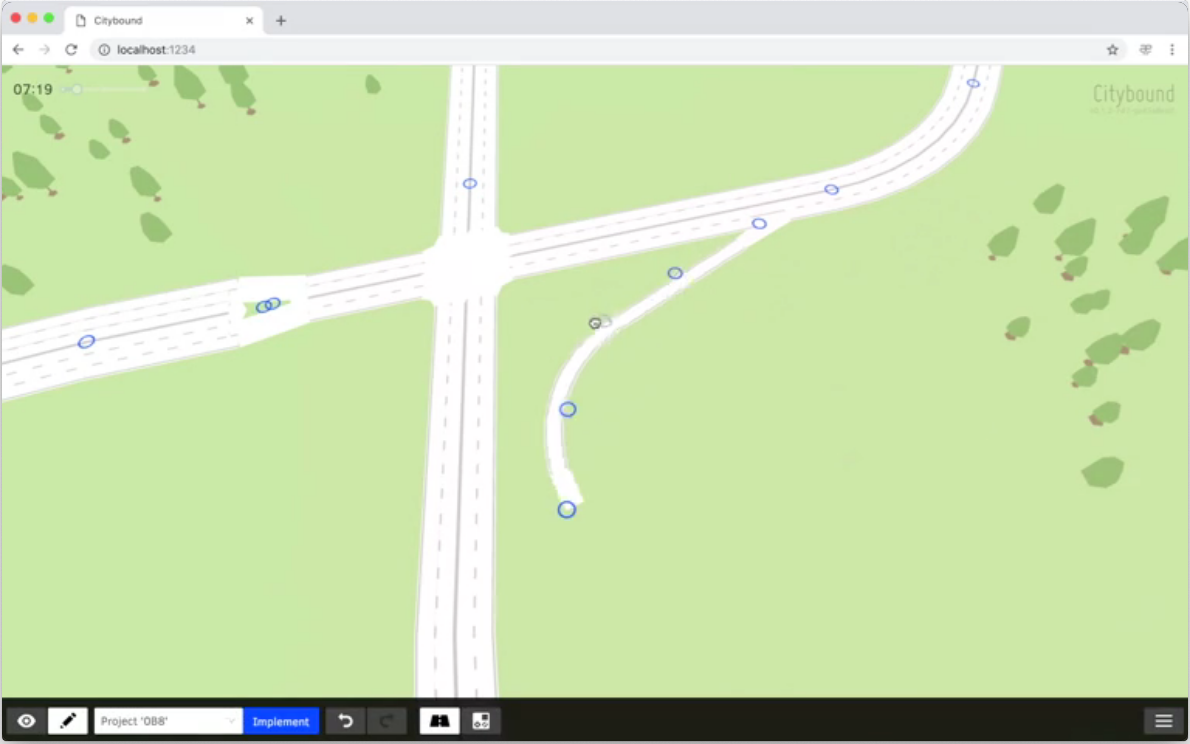
- Completely open source, written in rust
- Source: video at https://aeplay.org/citybound