The four stage model
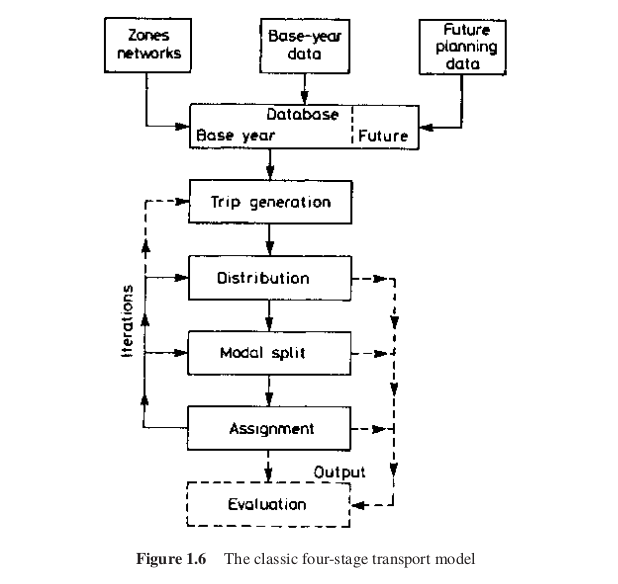
Still dominates transport planning models (Boyce and Williams 2015)
The four stage model
Still dominates transport planning models (Boyce and Williams 2015)
Impacting the durrent software landscape
Dominated by a few proprietary products
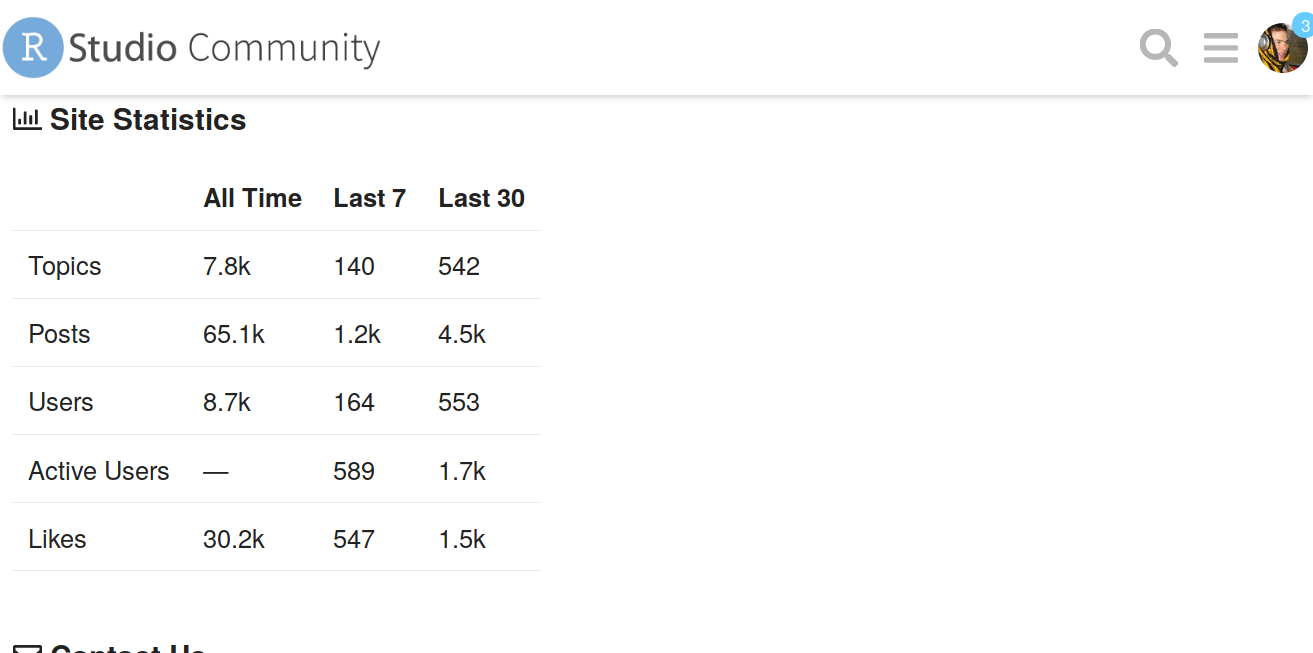
Limited support community online
High degree of lock-in
Limited cross-department collaboration
User support
Getting help is vital for leaning/improving software

User support
Getting help is vital for leaning/improving software
"10-Hour Service Pack $2,000" (source: caliper.com/tcprice.htm)
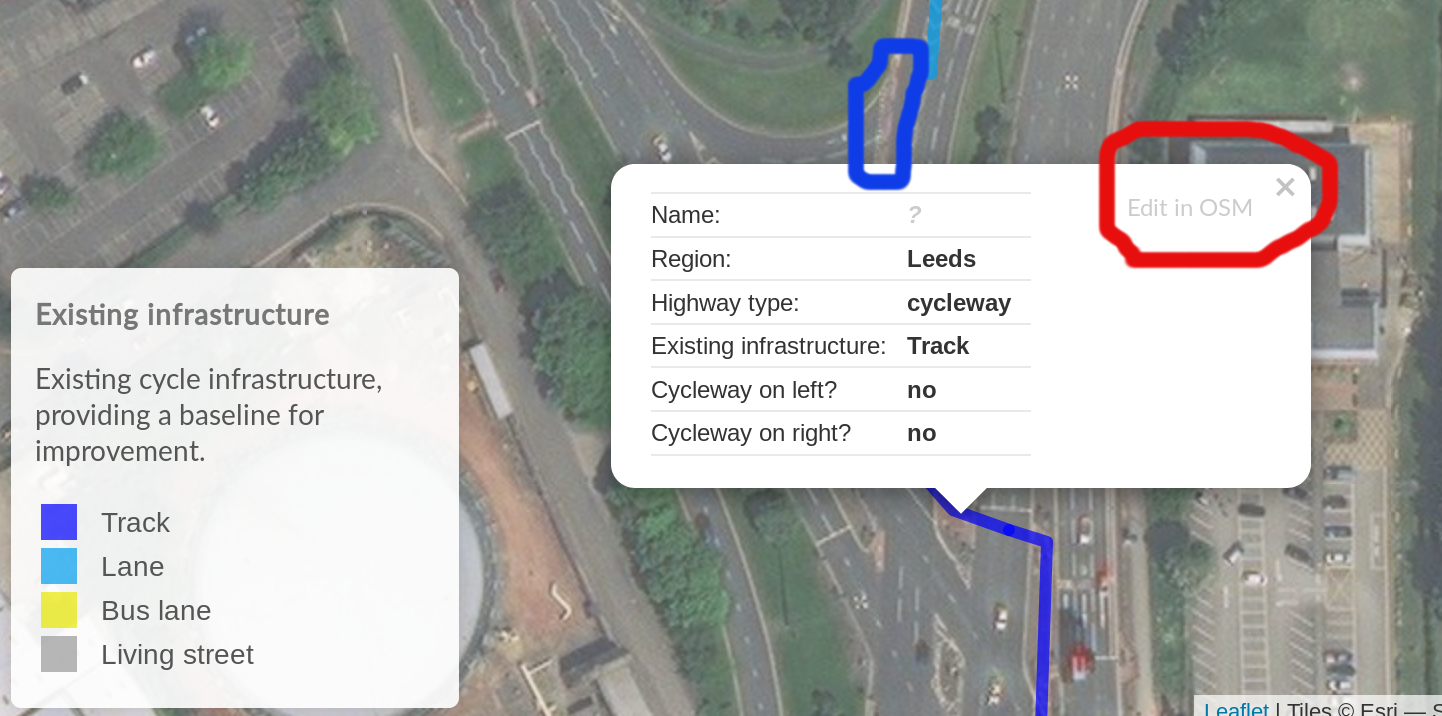


Context: trip to Tecklenburg

That we recorded on phone GPS
And uploaded to OpenStreetMap
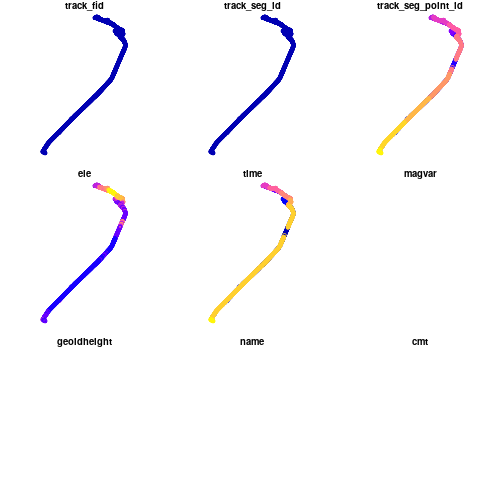
Static plotting
plot(track[1])plot(track_points)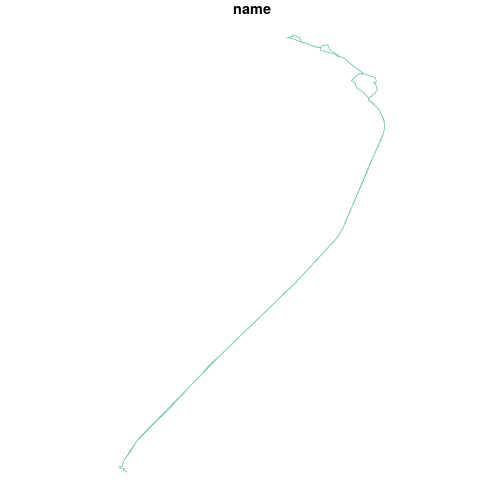
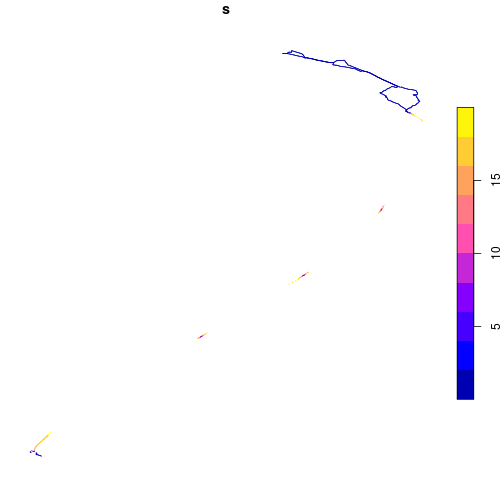
Creating lines with attributes
l = points2line_trajectory(p = track_points)plot(l["s"])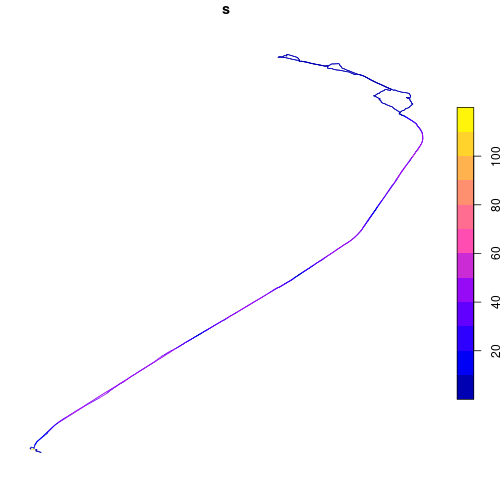
All slow sections
l_slow = l[l$s < 20, ]plot(l_slow["s"])