Open source software for decaRbonisation
A case study of tools to support sustainable transport plans
Robin Lovelace, for UseR Edinburgh (EdinbR)
2021-11-17. Source code: github.com/robinlovelace/presentations
Bio
I'm an Associate Professor of Transport Data Science at the Leeds Institute for Transport Studies (ITS) with research interests ranging from optimal zoning systems for urban analysis to analysis of road safety data. I have experience not only researching but deploying transport models in inform sustainable policies, and have used R heavily in my role as Lead Developer of the Propensity to Cycle Tool (see www.pct.bike), an open source and open access tool used by dozens of transport authorities to support evidence-based design of strategic cycle networks. I'm also a keen R user, developer and teacher, author of Geocomputation with R and several R packages.


Background, collaborations, interests
- BSc in Geography (Bristol) and MSc in Environmental Science (York), PhD in energy costs of commuting 2014
- Limitations of available tools for modelling led to the development of new methodologies and the book Spatial Microsimulation with R (2016)
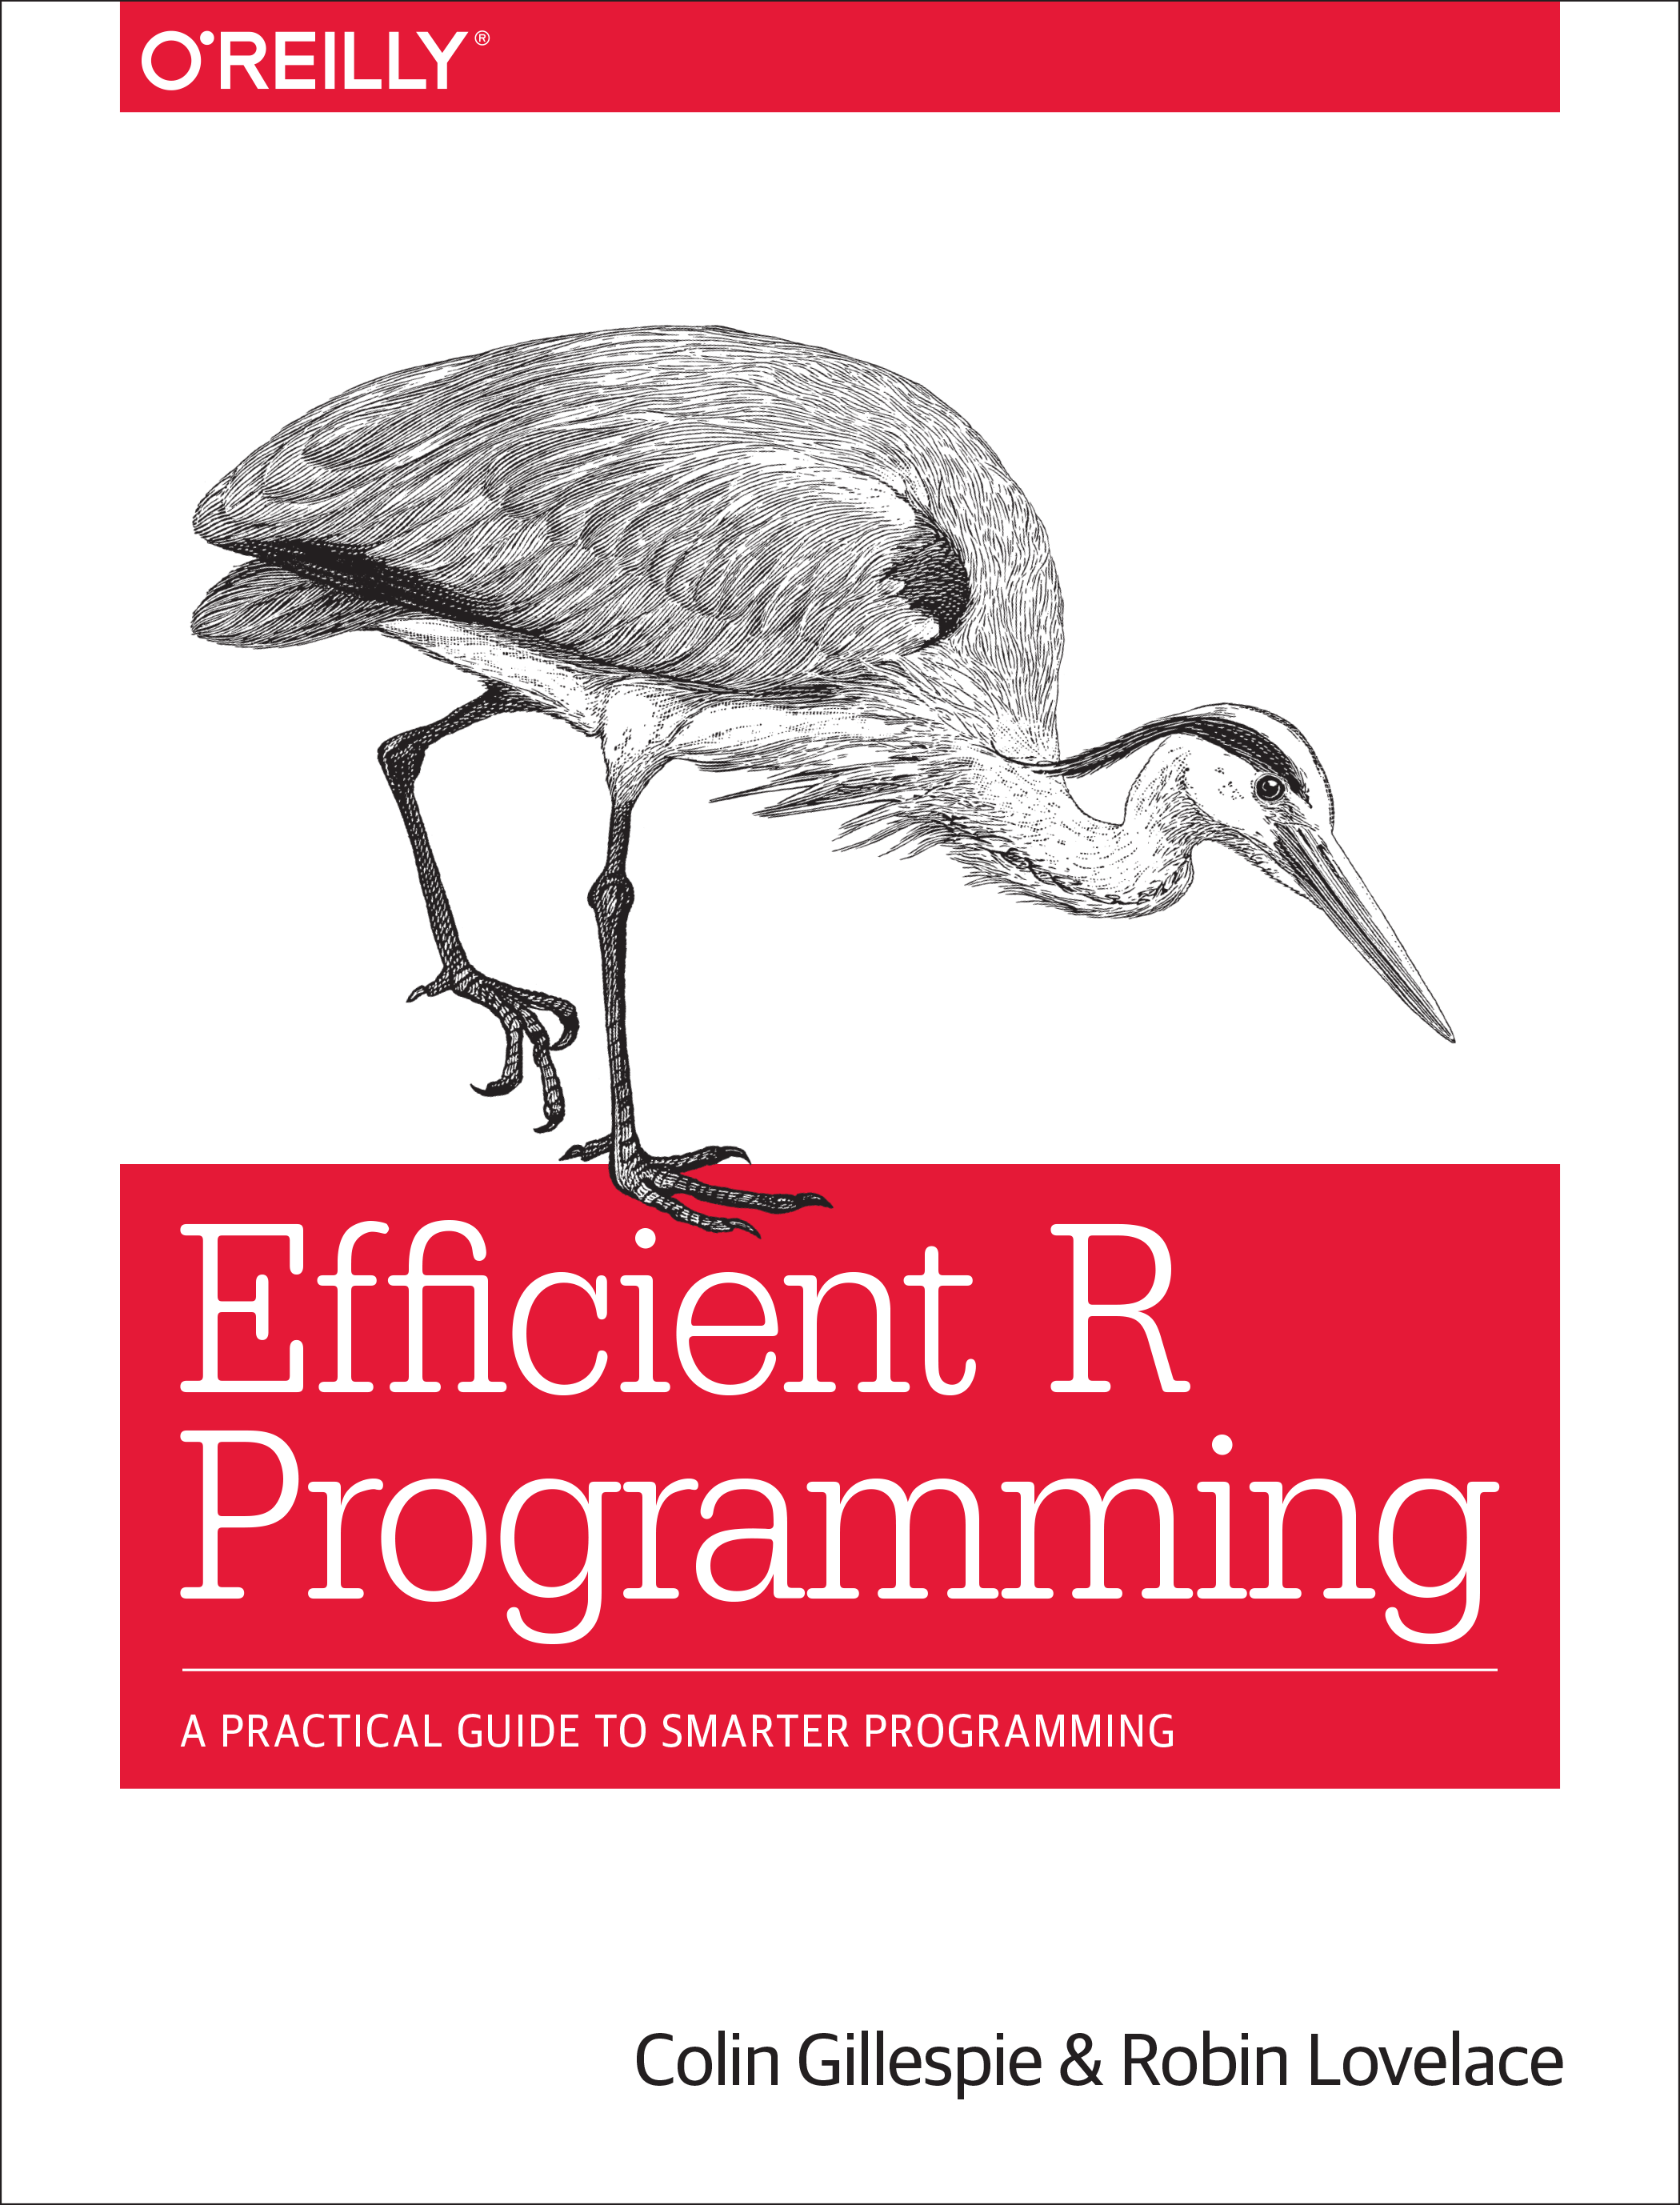
- Co-authored Efficient R Programming (2016)
- Lead Developer of Propensity to Cycle Tool (PCT) (2017)
- Author of Geocomputation with R (2019)
- Lots of papers!
Teaching materials and data science training
knitr::include_graphics(c( "https://images.tandf.co.uk/common/jackets/amazon/978149871/9781498711548.jpg", "https://csgillespie.github.io/efficientR/figures/f0_web.png", "https://geocompr.robinlovelace.net/images/cover.png"))


Teaching materials and data science training
knitr::include_graphics(c( "https://images.tandf.co.uk/common/jackets/amazon/978149871/9781498711548.jpg", "https://csgillespie.github.io/efficientR/figures/f0_web.png", "https://geocompr.robinlovelace.net/images/cover.png"))


- Data science training for the Department for Transport, Highways England, RAC Foundation
- Hackathons sponsored by the R foundation and the Department for Transport
Geographic methods for policy making
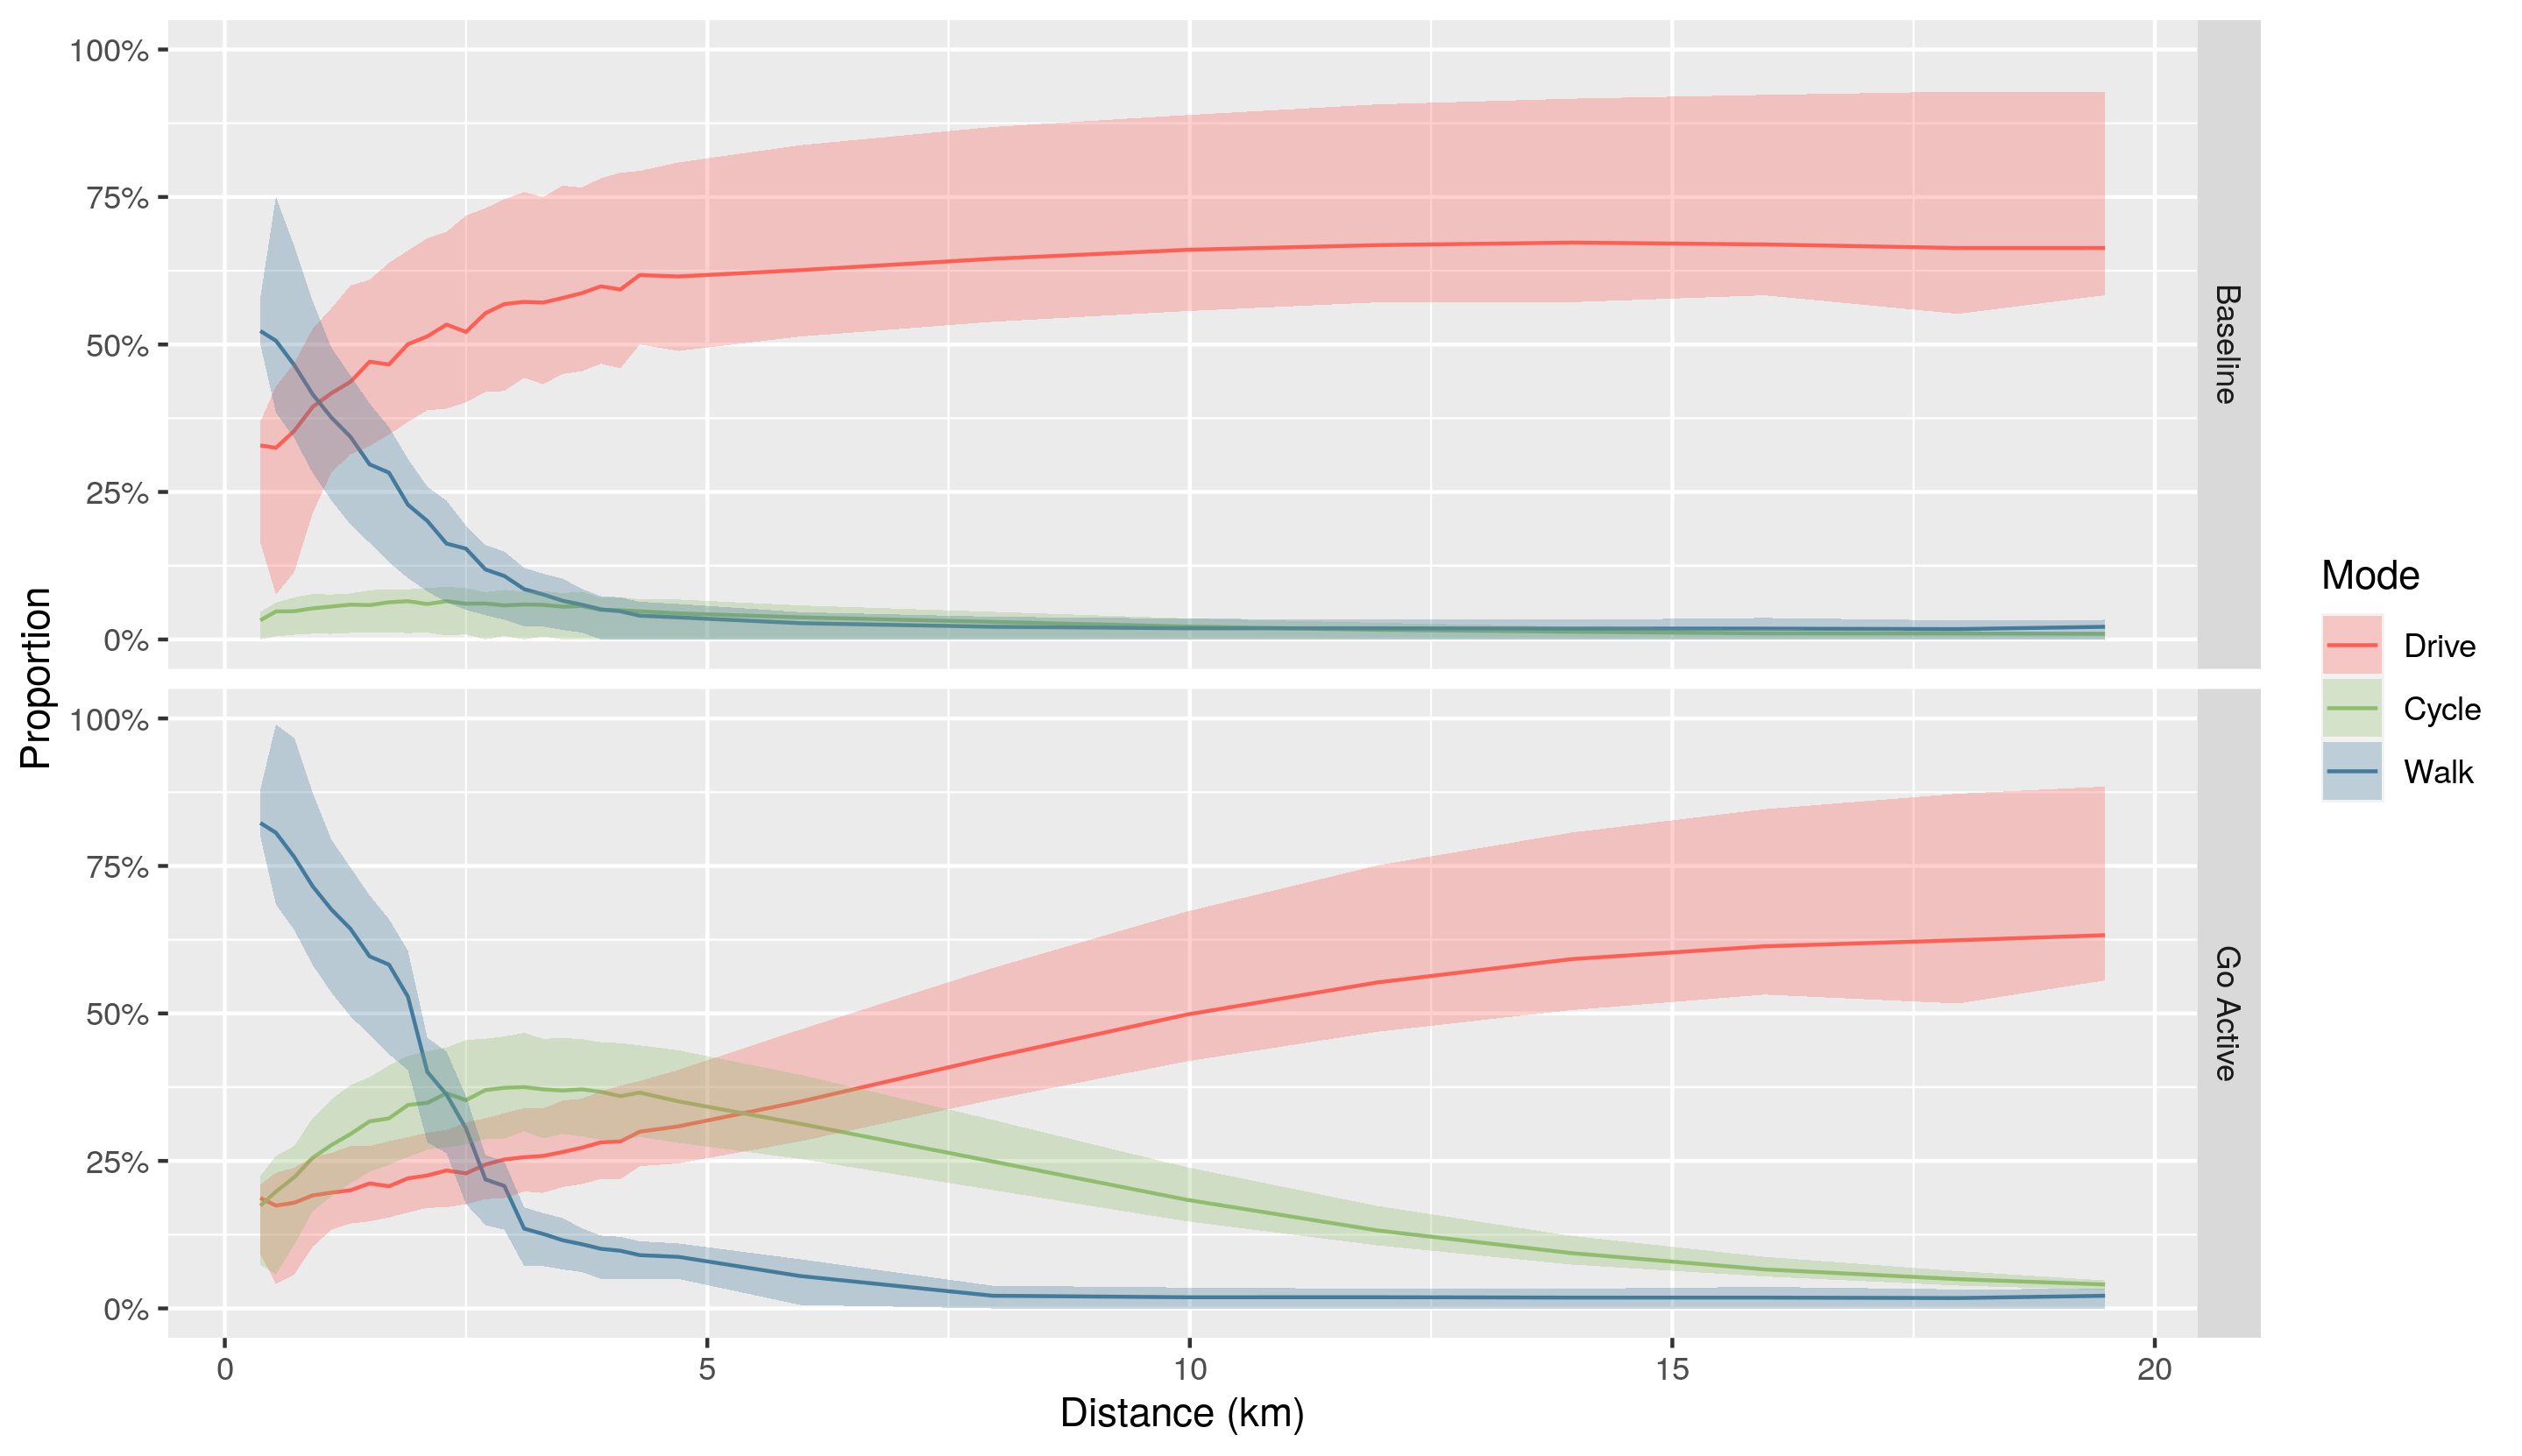
Lead Developer of the DfT's PCT (Lovelace et al. 2017) : transformational impact on planning in the UK (source: REF Impact Case Study)
COVID response: RAPID tool (Lovelace et al. 2020)
ActDev tool for informing planning process
Open source software, community building

Domain experience
Close working relationship with DfT over past 6 years
Collaborations with Ordnance Survey (LIDA), National Highways (training), links with DLUHC and Open Innovation Team
Transport behaviour, infrastructure, safety, energy


Ideas
Hackathons
Active travel
Road safety policy
Post COVID recovery
Levelling up metrics
Nature recovery networks
Citizen science and data literacy


Climate change: The elephant in the room
What is climate change? And how does it related to open source software?
It's great to be able to talk about climate change upfront. Usually it's behind the scenes.
To solve problems you need to talk about them.
Everyone including the elephant knows that climate change means the world is getting warmer.
But fewer people talk about 'global drying' and likely impacts such as sudden sea level rise that can only be described as catastrophic
As with health, the most solutions tackle the root causes of the problem. So what is the root cause of the problem? We can go back a few steps...
Climate change is caused by emissions.
Emissions are (primarily) caused by combustion of fossil fuels
But what causes that? Energy consumption.
What causes energy use? Demand for energy intensive things, transport, manufacturing
The Downward trend during coronavirus saw emissions drop by ~10%
The scale of the challenge is to reduce emissions by 10% every year, every year, and the challenge gets hard with each year
That means: we need transformational

The Downward trend during coronavirus saw emissions drop by ~10%
The scale of the challenge is to reduce emissions by 10% every year, every year, and the challenge gets hard with each year
That means: we need transformational change, we need to be on a war footing
Decarbonisation
That may sound counter-intuitive given that we have an over-supply of fossil fuels
But it's a sense of scarcity that makes people move from being economic satisficers to maximers
And a sense of scarcity is driven by fear - so an important response to climate change is to not respond fearfully but optimistically
Consumption is often portrayed as a bottom-up process but in fact it's largely top-down: people who have too much wanting more, dedicating their lives to increasing their share of the pie
In a society where people have a sense of abundance, there will be fewer people who feel the need to accumulate and compete
Only demand side solutions can work
We're barrelling head first into a cataclysmic climate disaster of planetary scale, and our governments and economies are COMPLETELY disregarding the emergency exit that would spare us. We're not going to make it, and it's not because "solutions" don't exist.
— Prof Julia 🌍🌹🌱 ClimateAction FightFascism 🇵🇸 (@JKSteinberger) July 14, 2021
A 🧵, I guess.
1/
How open source software can help?
- Open source software creates a sense of abundance
How open source software can help?
Open source software creates a sense of abundance
Open source software is energy efficient
How open source software can help?
Open source software creates a sense of abundance
Open source software is energy efficient
Open source software discourages waste
How open source software can help?
Open source software creates a sense of abundance
Open source software is energy efficient
Open source software discourages waste
Open source software enables transparent + participatory evidence -> buy-in
Case studies
pkgs = c( "pct", "abstr" )# install...install.packages(pkgs)vignette( "getting" )Check the docs and play with the example datasets. Ask questions and build the community!

Source: ATUMEdinburgh project + a-b-street.org
 Play with some data for your city (only England for now sorry)
https://github.com/Robinlovelace/openTransportDataDemo
Thanks, links, happy R day travels 🚶, 🚲 + 🚀!
Reproducible slides: github.com/robinlovelace/presentations
Transport chapter in Geocomputation with R (feedback welcome): geocompr.robinlovelace.net
Slides created via the R package xaringan.