The problem

Source: 'Inside the black box' report
- Transport models were designed to support growth in car ownership and reduce journey times (Boyce and Williams, 2015)
The problem
Source: 'Inside the black box' report
Transport models were designed to support growth in car ownership and reduce journey times (Boyce and Williams, 2015)
21^st^ Century priorities are very different
The problem
Source: 'Inside the black box' report
Transport models were designed to support growth in car ownership and reduce journey times (Boyce and Williams, 2015)
21^st^ Century priorities are very different
- Climate science, air pollution and health force a shift in focus
- The concepts of 'participatory democracy' and 'citizen science' mean there is a need for collaborative solutions
The solution
New technologies mean that open access transport models are possible
 Source: A/B Street, free, open source, gamified transport planning software github.com/dabreegster/abstreet

From open source to open access

- Transport models represent a leverage point in transport systems
- New paper, Lovelace et al (2020) describes the emergence and possibilities for 'open access models'
What is science?
- Scientific knowledge is hypotheses that can be falsified
- Science is the process of generating falsifiable hypotheses and testing them
- In a reproducible way
- Systematically
What is science?
- Scientific knowledge is hypotheses that can be falsified
- Science is the process of generating falsifiable hypotheses and testing them
- In a reproducible way
- Systematically
- Falsifiability is central to the scientific process (Popper, 1959)
- All of which requires software conducive to reproducibility

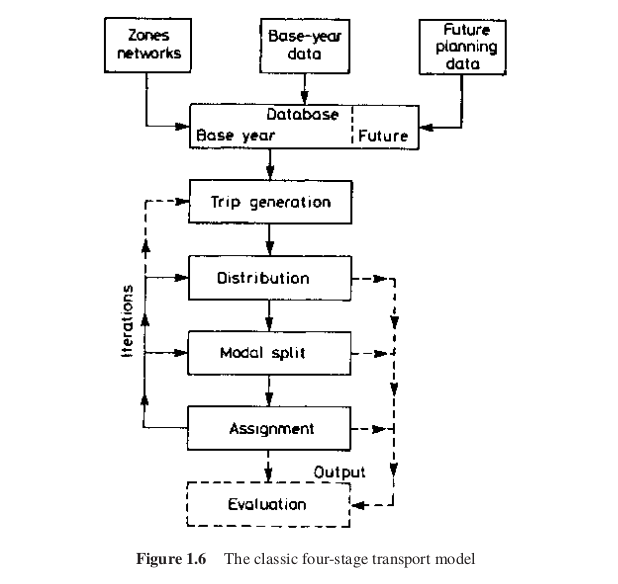
Still dominates transport planning models (Boyce and Williams 2015)
Still dominates transport planning models (Boyce and Williams 2015)
The four stage model (left)
Impacts the current software landscape
Dominated by a few proprietary products
Limited support community online
High degree of lock-in
Limited cross-department collaboration
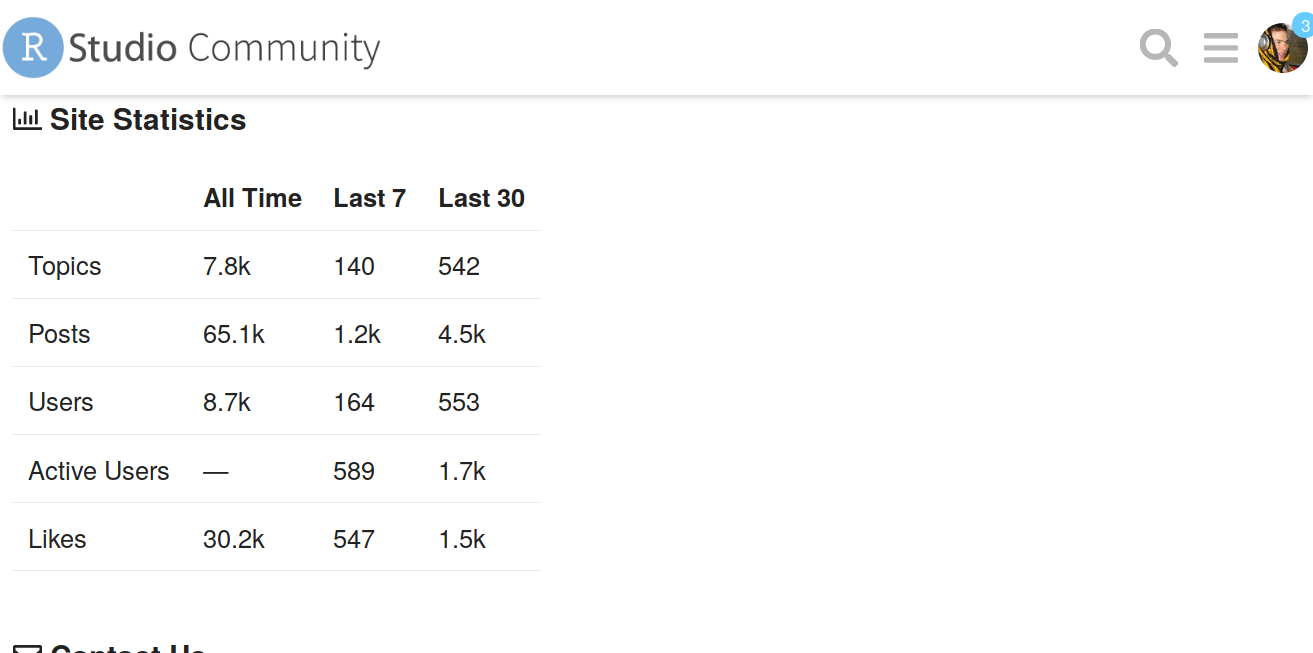
User support
Getting help is vital for leaning/improving software

User support
Getting help is vital for leaning/improving software
"10-Hour Service Pack $2,000" (source: caliper.com/tcprice.htm)
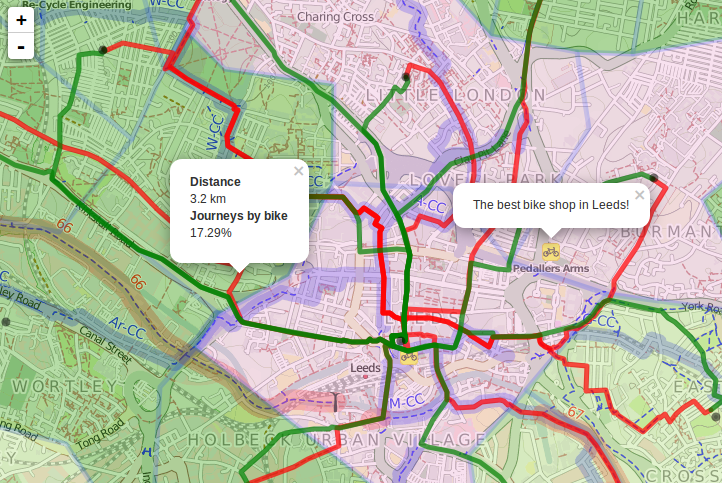
Visualising data
A fundamental part of data science is being able to understand your data.
That requires visualisation, R is great for that:
plot(desire_lines)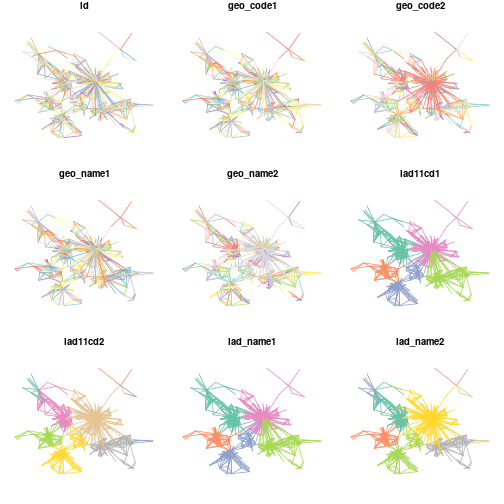
- Interactively:
library(tmap)tm_shape(desire_lines) + tm_lines("all")Checking the results:
b = c(0, 25, 50, 75)tm_shape(car_dependent_routes) + tm_lines(col = "percent_drive", lwd = "all", scale = 5, breaks = b, palette = "-inferno")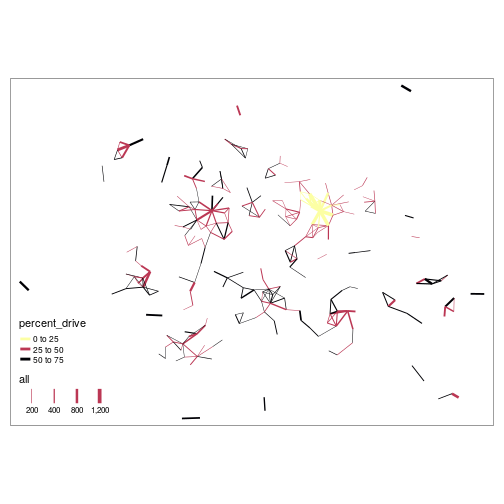
Is already here II
The ActDev project:

- A/B Street - R integration, see https://github.com/a-b-street/abstr
Live demo

Thanks
Contact me at r. lovelace at leeds ac dot uk (email), @robinlovelace
Check-out links to my work at robinlovelace.net
Thanks to everyone building a open and collaborative communities
Thanks to the University of Leeds and the Institute for Transport Studies
