Outline
The problem
Solutions
How R can help
whoami
Environmental geographer
Learned R for PhD on energy and transport
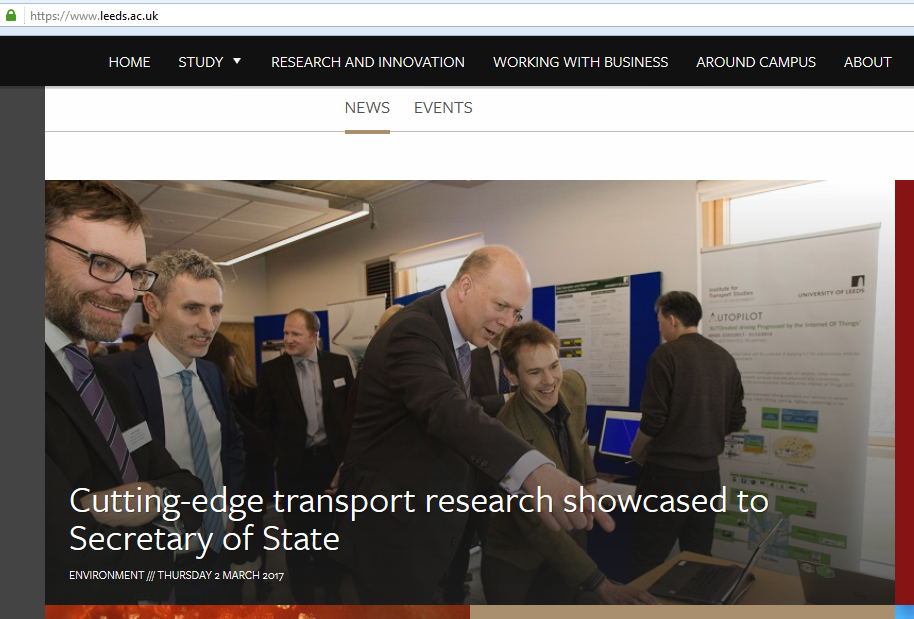
Now work at the University of Leeds (ITS and LIDA)
Working on Geocomputation with R
devtools::install_github("r-rust/gifski")system("youtube-dl https://youtu.be/CzxeJlgePV4 -o v.mp4")system("ffmpeg -i v.mp4 -t 00:00:03 -c copy out.mp4")system("ffmpeg -i out.mp4 frame%04d.png ")f = list.files(pattern = "frame")gifski::gifski(f, gif_file = "g.gif", width = 200, height = 200)Image credit: Jeroen Ooms + others
knitr::include_graphics("https://user-images.githubusercontent.com/1825120/39661313-534efd66-5047-11e8-8d99-a5597fe160ff.gif")
Transport: growing source of emissions
knitr::include_graphics("https://raw.githubusercontent.com/Robinlovelace/erum18-transport/master/transport-projections-ipcc.png")![]()
Transport: growing source of emissions
knitr::include_graphics("https://raw.githubusercontent.com/Robinlovelace/erum18-transport/master/transport-projections-ipcc.png")![]()
People like to travel!
Does not 'saturate' with income
Hard to decarbonise via technology

Another problem...

Another problem...
Data overload
Simplify the data deluge
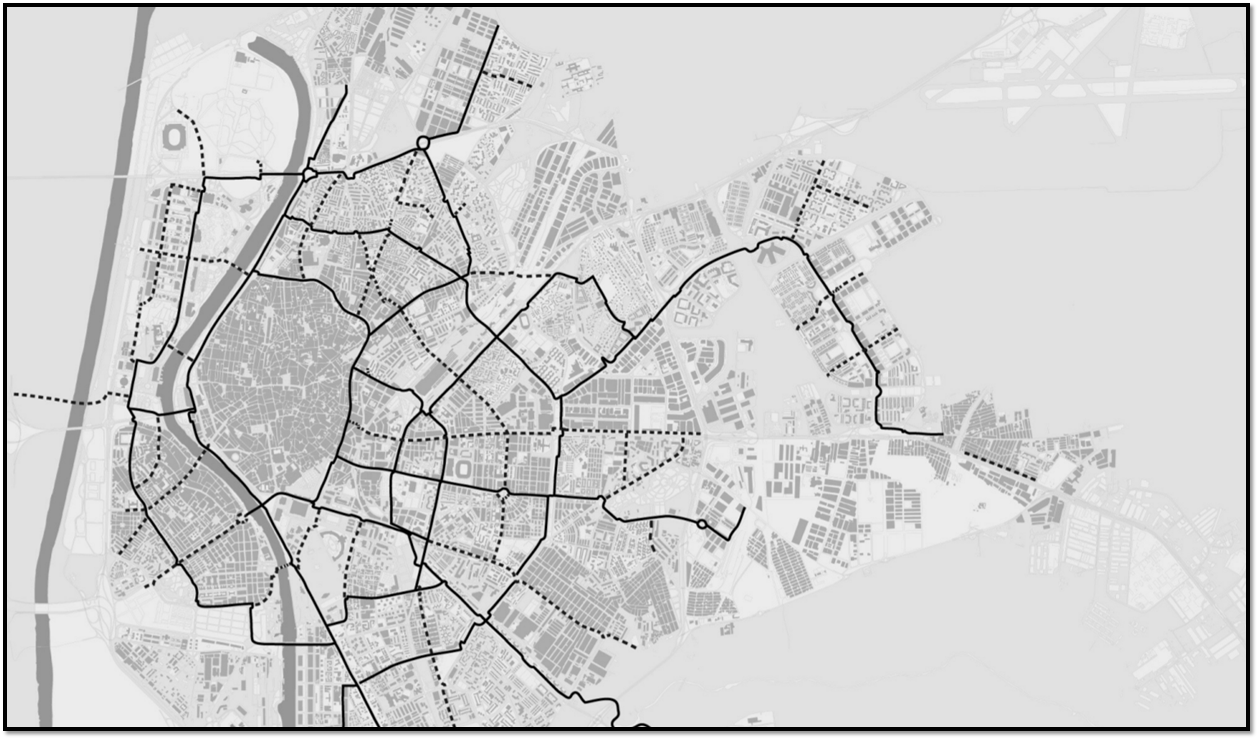
Cycling network in Seville: 'basic' (77 km) and ‘complementary’ (120 km, dashed line) cycleways (from Marqués et al. 2015). Led to fourfold increase in cycling.
Estimate cycling pontential: the Propensity to Cycle Tool - see www.pct.bike
Included in UK policy (CWIS) used by many local authorities (LCWIP) (Lovelace, Goodman, Aldred, Berkoff, Abbas, and Woodcock, 2017)
Build infrastructure
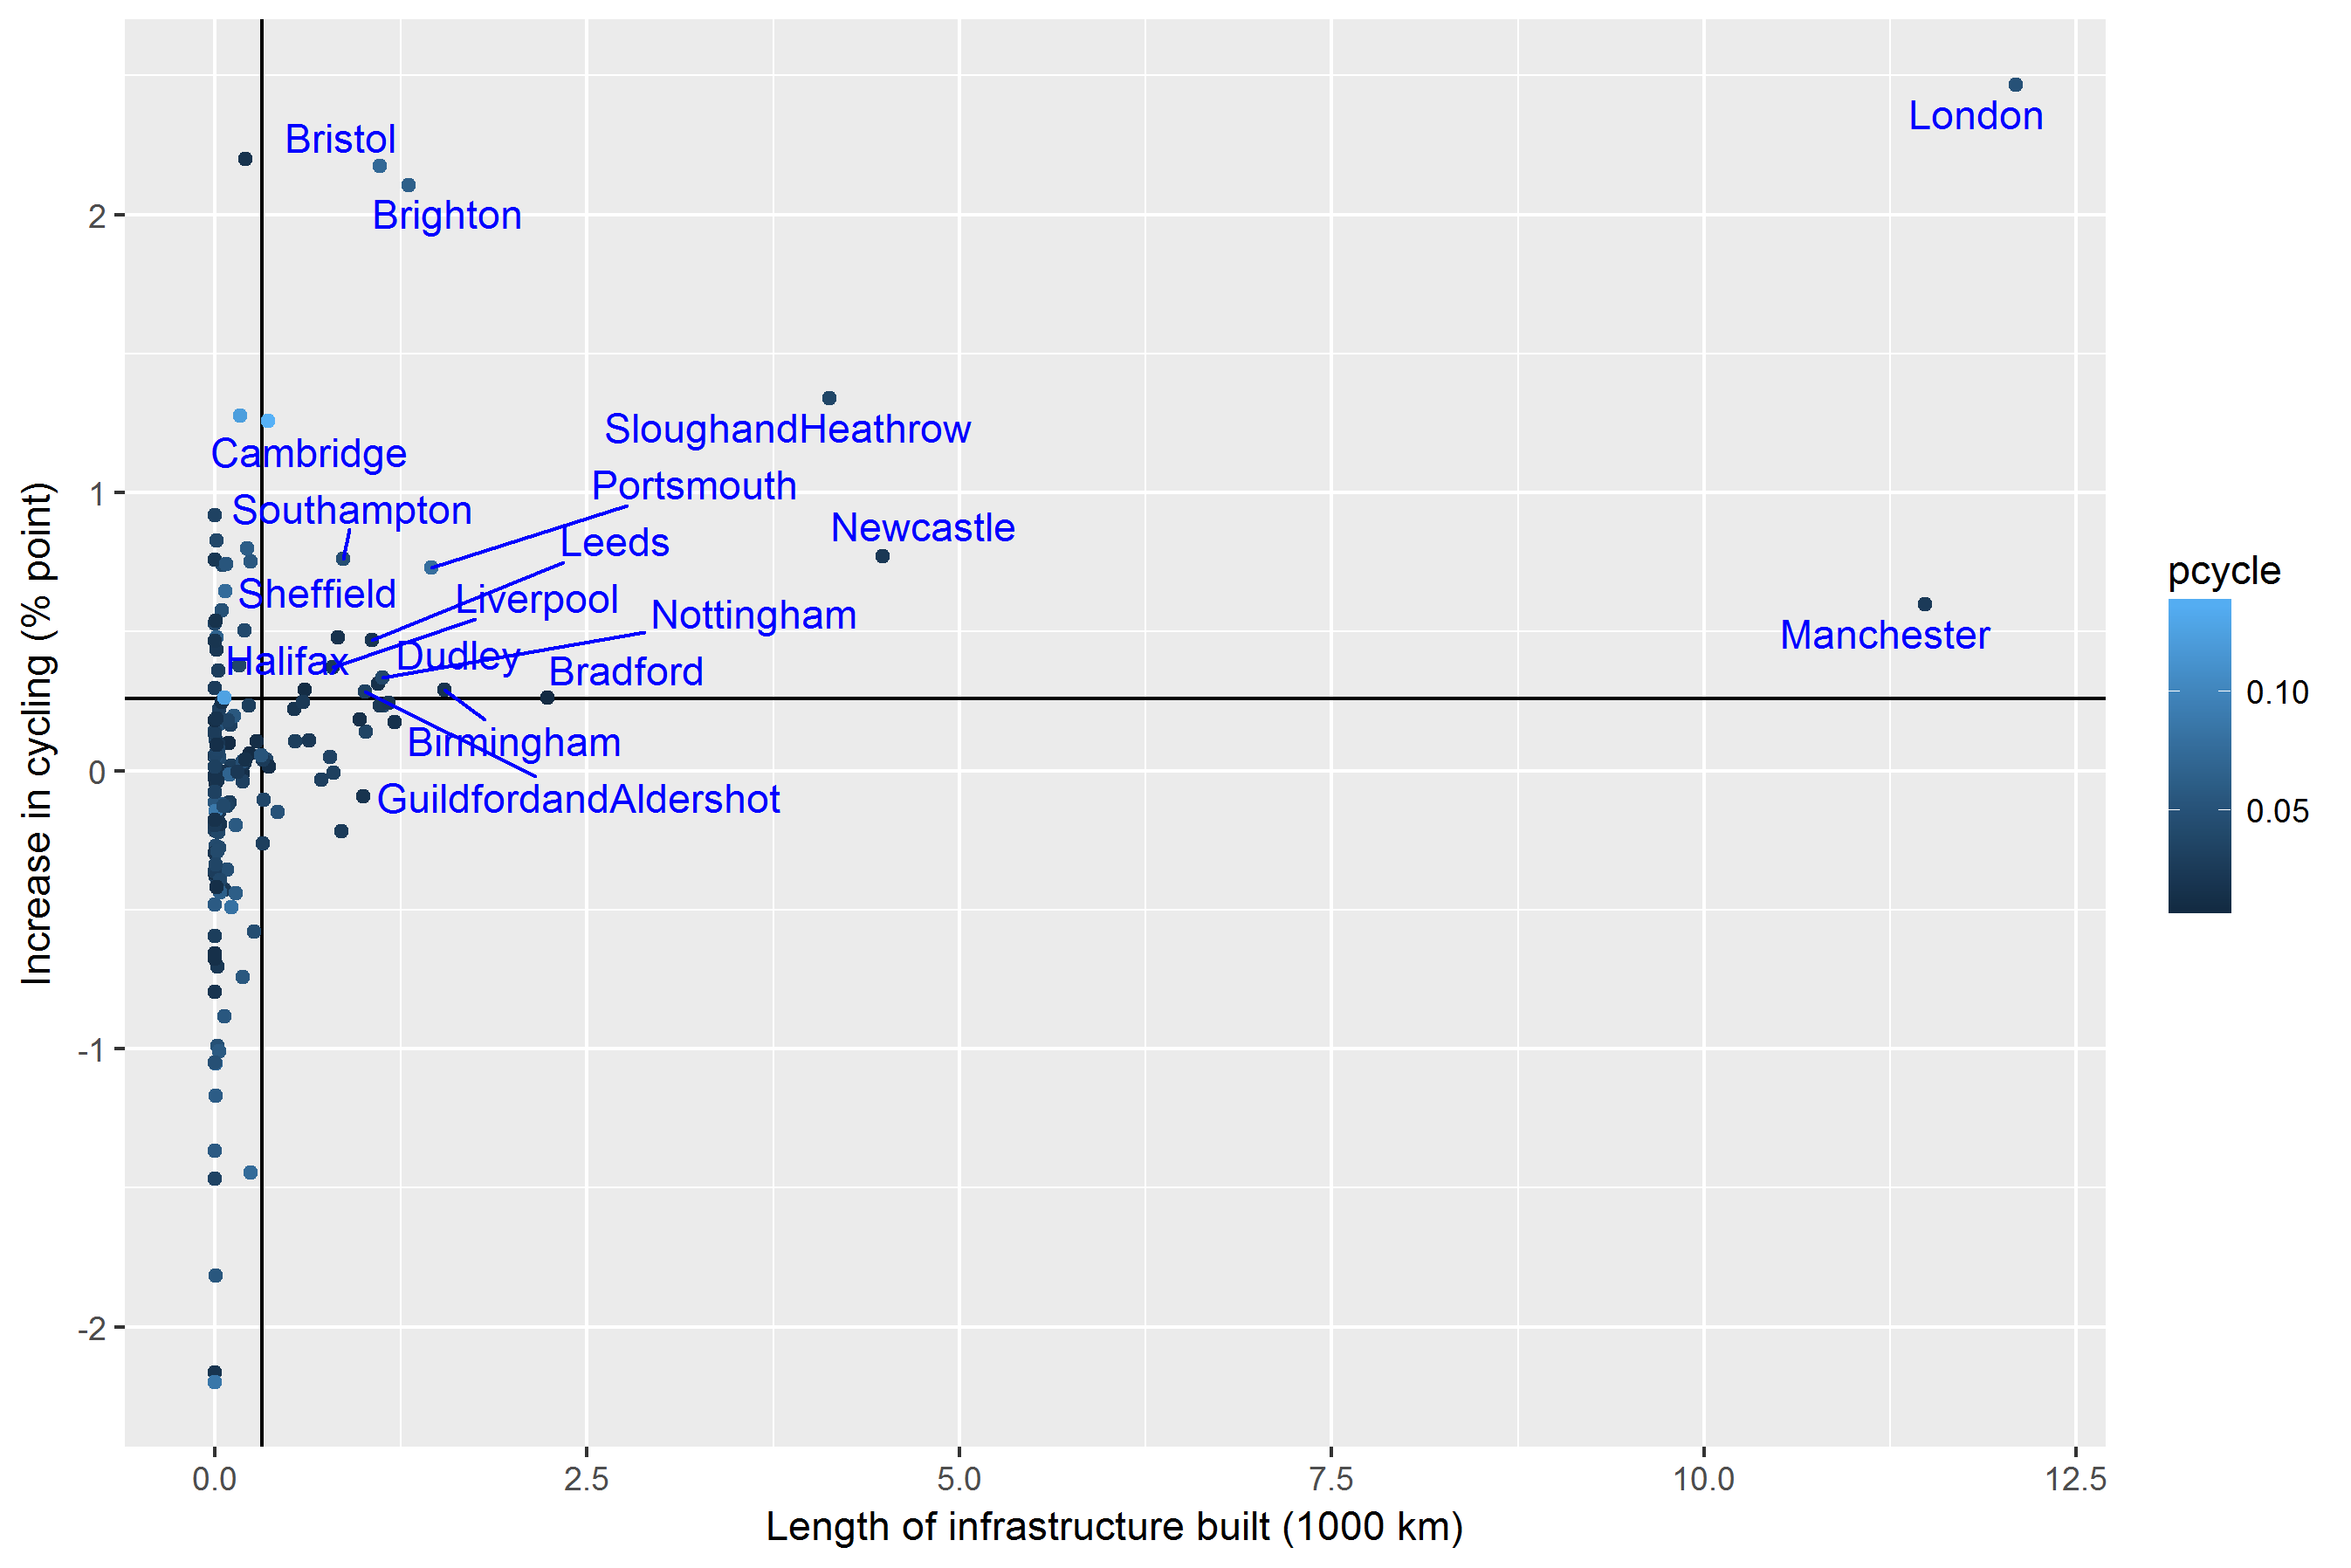
- Link between infrastructure and uptake between 2001 and 2011 in English regions
- But how to ensure that infrastructure is effective?
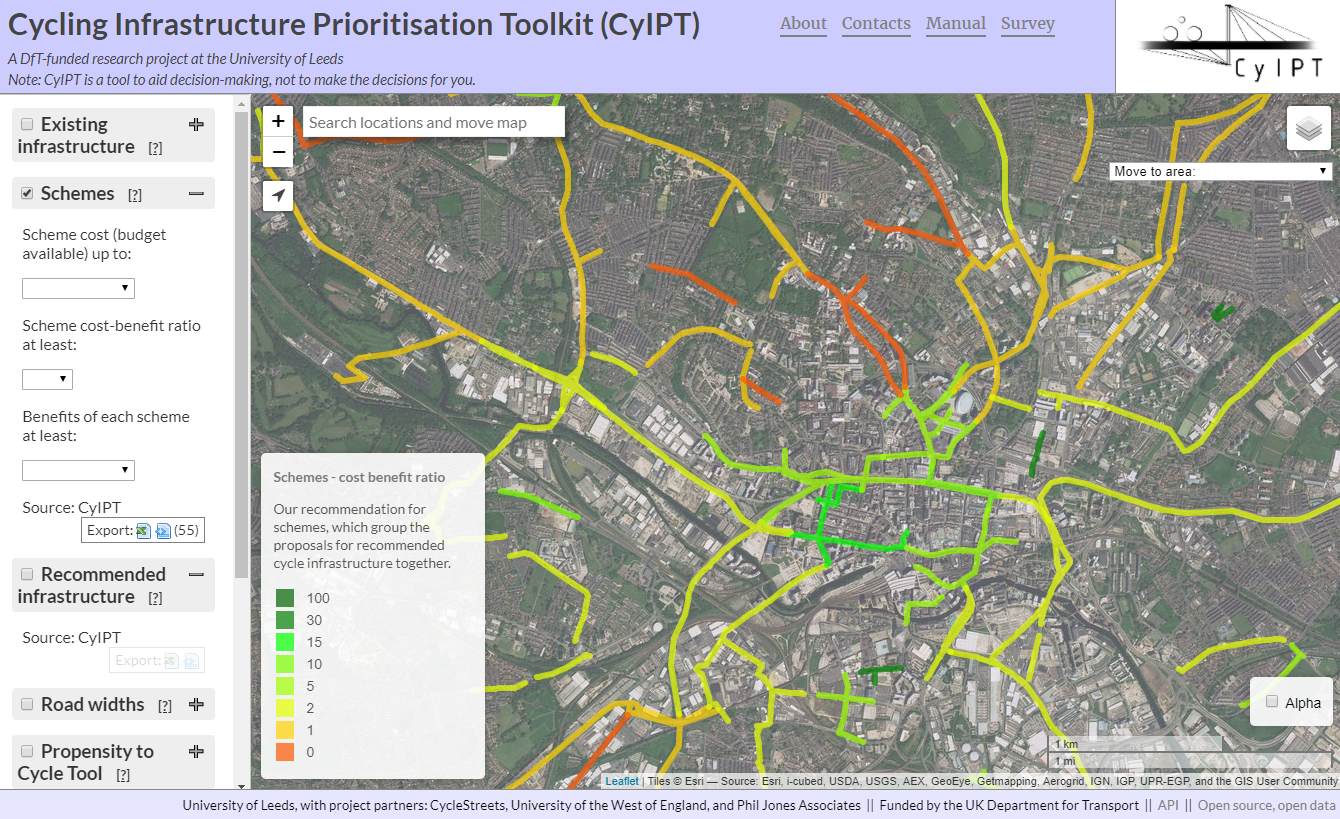
Identify cost-effective schemes: the CyIPT
- A
publicly availablepassword protected web app providing accessible evidence on cycling infrastructure hosted at www.cyipt.bike
References
Lovelace, Robin and Richard Ellison (2018). Stplanr: Sustainable Transport Planning. R package version 0.2.4. URL: https://github.com/ropensci/stplanr.
Lovelace, Robin, Anna Goodman, Rachel Aldred, et al. (2017). "The Propensity to Cycle Tool: An Open Source Online System for Sustainable Transport Planning". In: Journal of Transport and Land Use 10.1. ISSN: 1938-7849. DOI: 10.5198/jtlu.2016.862. URL: https://www.jtlu.org/index.php/jtlu/article/view/862 (visited on Jun. 01, 2017).
Lovelace, Robin, Jakub Nowosad and Jannes Meunchow (2018). Geocomputation with R. CRC Press. URL: http://robinlovelace.net/geocompr (visited on Oct. 05, 2017).
Pebesma, Edzer (2018). Sf: Simple Features for R. R package version 0.6-3. URL: https://github.com/r-spatial/sf/.
R Core Team (2018). R: A Language and Environment for Statistical Computing. Vienna, Austria. URL: https://www.R-project.org/.
![]()
![]()